Sunday, March 24, 2013

Process NMR Associates and Pfizer Present Joint Poster on Reaction Monitoring at PittCon

Pfizer has included the Aspect-60 MHz NMR system in their reaction monitoring investigations. The analysis was performed on reactions that were monitored in parallel by a Bruker 400 MHz NMR system. The poster of the initial results will be presented by Dr David Foley of Pfizer at this weeks PittCon in Philadelphia.

The presentation is available here.


SMASH Posters Cover Aloe Vera NMR Test Method, Heavy Petroleum Average Molecule Characterization, and 60 MHz Permanent Magnet NMR Applications

Quantitative 1H qNMR Method for Complex Mixture Analysis: Determination of Acetylated Polysaccharides, Glucose, Maltodextrin, Isocitrate, Preservatives, Additives and Degradation Products in Aloe Vera Leaf Juice – Raw Material and Consumer Products
Practical Applications of Compact, Cryogen-Free High-Resolution 60 MHz Permanent Magnet NMR Systems for Reaction Monitoring and Online/At-Line Process Control
Calculation of Average Molecular Descriptions of Heavy Petroleum Hydrocarbons by Combined Analysis by Quantitative 13C and DEPT-45 NMR Experiments

Process NMR Associates to Present 3 Posters at SMASH NMR Conference, September 9-12, 2012

News - John Edwards of Process NMR Associates will be presenting the following 3 posters at SMASH NMR Conference, Providence RI, September 9-12, 2012. Process NMR Associates will also have a vendor table where John will be available to discuss the exciting range of high and low resolution permanent magnet NMR products available through the company and it’s partners Aspect AI and Cosa-Xentaur.

Poster 1
Quantitative Proton Nuclear Magnetic Resonance Spectrometry (1H-NMR) for Determination of Acetylated Polysaccharides, Glucose, Maltodextrin, and Isocitrate in Aloe Vera Leaf Juice
John C. Edwards, Process NMR Associates, Danbury, Connecticut
Aloe Vera is a botanical component that is used widely in the cosmetic, natural product, herbal supplement, and pharmaceutical industries. The widespread use of Aloe Vera has lead to the need to adequately analyze the authenticity, quality, and quantity of the various components present in this material. The qNMR method described here was developed and validated by Process NMR Associates (Danbury, CT) and is similar to an independently validated method developed by Jiao et al [1]. The method described is to be included in an upcoming Monograph on Aloe Vera published by the American Herbal Pharmacopoeia. The method can be used for the detection and quantitation of the primary components of interest in Aloe Vera juice products and raw materials for compliance with IASC (International Aloe Science Council) certification requirements, specifically, for determination of the content of acetylated polysaccharides, the presence of glucose, the presence and content of maltodextrin, and the content of isocitrate. Additionally, for meeting quality control specifications beyond IASC requirements, the presence and content of the following groups of compounds can be determined: degradation products (e.g., lactic acid, pyruvic acid, succinic acid, fumaric acid, acetic acid, formic acid, and ethanol), preservatives (e.g., potassium sorbate, sodium benzoate, and citric acid/citrate), and other atypical impurities, additives, or adulterants (e.g., methanol, glycine, glycerol, sucrose, maltodextrin, flavorants (propylene glycol/ethanol)). We will describe a common internal-standard NMR methodology that does not require additional equipment or advanced automation software. The method is applicable to a number of different Aloe Vera raw materials and products, including liquid and dried juices. In aloe vera finished products the method is only applicable when the observable aloe vera constituents are present at a high enough concentration to be observed and are not obscured by additional product ingredients with signals in overlapping areas.
1. “Quantitative 1H-NMR spectrometry method for quality control of Aloe vera products”, Jiao, P., Jia, Q., Randel, G., Diehl, B., Weaver, S., Milligan, G., J AOAC Int., 93(3), 842-848, 2010

Poster 2
Practical Applications of Compact, Cryogen-Free High-Resolution 60 MHz Permanent Magnet NMR Systems for Reaction Monitoring and Online/At-Line Process Control
John C. Edwards, Process NMR Associates, LLC, 87A Sand Pit Road, Danbury, CT 06810 USA
For the past two decades high resolution 1H NMR at 60 MHz has been utilized to monitor the chemical physical properties of refinery and petrochemical feedstreams and products1. These approaches involve the use of partial least squares regression modelling to correlate NMR spectral variability with ASTM and other official test methods, allowing the NMR to predict results of physical property tests or GC analysis. The analysis is performed in a stop flow environment where solenoid valves are closed at the beginning of the NMR experiment. This approach allows up to 5 or 6 different sample streams to be sent to the sample in order to maximize the impact of the instrument. The current work with these permanent magnet NMR systems is to utilize them as chemistry detectors for bench-top reaction monitoring, mixing monitoring, dilution monitoring, or conversion monitoring. In the past use of NMR for these applications has been limited by the need to bring the “reaction” to the typical “superconducting” NMR lab. A compact high resolution NMR system will be described that can be situated on the bench-top or in the fume hood to be used as a continuous or stop-flow detector and/or an “in-situ” reaction monitoring system. The system uses a unique 1.5 Tesla permanent magnet that can accommodate sample diameters of 3-10 mm with half-height resolution approaching 1-3 Hz (depending on the sample size) and excellent single pulse sensitivity. Reaction monitoring can be performed using a simple flow cell analyzing total system volumes of 2 to 5 mL depending on the length and diameter of the transfer tubing. Further, detection limits of analytes in the 200+ ppm range are possible without the use of typical deuterated NMR solvents. Analysis times of 5 to 20 seconds are also possible at flow rates of 5 to 20+ ml/minute. Reaction monitoring directly in standard 5-10 mm NMR tubes using conventional (non-deuterated) reactants, solvents and analytes will also be described. Examples of 1H, 19F and 31P analyses will be described.
1.“Process NMR Spectroscopy: Technology and On-line Applications” John C. Edwards, and Paul J. Giammatteo, in Process Analytical Technology: Spectroscopic Tools and Implementation Strategies for the Chemical and Pharmaceutical Industries, 2nd Ed., Editor Katherine Bakeev, Blackwell-Wiley, 2010

Poster 3
Calculation of Average Molecular Descriptions of Heavy Petroleum Hydrocarbons by Combined Analysis by Quantitative 13C and DEPT-45 NMR Experiments
John C. Edwards
Process NMR Associates, LLC, 87A Sand Pit Rd, Danbury, CT 06810 USA
Over the years much debate has centered around the validity and accuracy of NMR measurements to accurately describe the sample chemistry of heavy petroleum materials. Of particular issue has been the calculated size of aromatic ring systems that in general seem to be underestimated in size by NMR methods. This underestimation is principally caused by variance in chemical shift ranges used by researchers to define the aromatic carbon types observed in the 13C NMR spectrum, in particular the bridgehead aromatic carbons that can be shown to overlap strongly with the protonated aromatic carbons. The ability to discern between bridgehead aromatic carbons and protonated carbons in the 108-129.5 ppm region of the spectrum is key in the derivation of molecular parameters that properly describe the “molecular average” present in the sample. Utilizing methodologies developed by Pugmire and Solum [1] for the solid-state 13C NMR analysis of coals and other carbonaceous solids we have developed a new liquid-state 13C NMR method that allows the relative quantification of overlapping protonated and bridgehead aromatic carbon signals to be determined [2]. The NMR experiments involve the combined analysis of both quantitative 13C single pulse excitation which observes “all carbons in the sample” and DEPT45 polarization transfer which observes only the protonated carbons in the sample. Though the DEPT45 results are not quantitative across all carbon types (CH, CH2, and CH3) due to polarization transfer differences, the technique is well enough understood that simple multiplication factors allow the relative intensities of the different carbons to be determined. An additional aspect of the experiments is the addition of a standard material (PEG polymer) that allows the calculation of the absolute percentage of the carbons observed by the NMR technique. This allows the relative amount of bridgehead carbon to be calculated by direct comparison of the aromatic region with the standard signal intensity. The average ring system sizes derived from these NMR experiments tend to be several ring systems larger than has been calculated in previous studies. In asphaltenes for example the ring systems are 5-7 rings in size rather than the 3-4 rings reported previously. The ring sizes determined by this new combined NMR method are in agreement with FTICR-MS and fluorescence measurements.
1) “Carbon-13 Solid-State NMR of Argonne Premium Coals”, Mark S. Solum, R.J. Pugmire, David M. Grant, Energy Fuels, 1989, 3(2), pp 187-193
2)” Comparison of Coal-Derived and Petroleum Asphaltenes by 13C Nuclear Magnetic Resonance, DEPT, and XRS”, A. Ballard Andrews, John C. Edwards, Andrew E. Pomerantz, Oliver C. Mullins, Dennis Nordlund, and Koyo Norinaga, Energy Fuels, 2011, 25 (7), pp 3068–3076

Process NMR (High, Mid and Low Resolution) Session at Practical Applications of NMR in Industry Conference

John Edwards (PNA) and Mark Zell (Pfizer) are co-chairs of a session of practical NMR applications in process control, reaction monitoring, miniaturized instrumentation, TD-NMR. John Edwards is also co-chairing a session (with Kathleen Farley of Pfizer) on quantitative NMR that contains an excellent talk on quantitative online NMR spectroscopy. Speakers in our sessions include:
Session: On-Line/In-Line NMR and Time-Domain NMR
Session Chairs: John Edwards, Process NMR Associates and Mark Zell, Pfizer, Inc.
On-Line Applications of High-Resolution NMR in the Petroleum Industry – Direct Measurement, Chemometric Correlation, and Multiple Spectroscopy Data Fusion – John Edwards, Process NMR Associates, Danbury, CT USA
Online NMR Reaction Monitoring in Pharmaceutical Process Development – David Foley, Pfizer Global Research and Development, Groton, CT USA
Beyond Hammers in Search of Nails: An instrument technologist’s perspective on developing miniaturized NMR spectrometers for new applications – Andrew McDowell, ABQMR, Inc., Albuquerque, NM USA
LF-NMR Studies of Mechanically Induced Gel Syneresis in Cheese – Soren Engelsen, University of Copenhagen, Frederiksberg, Denmark
NMR Quantification of Structural Features in Food Science and Technology – John van Duynhoven, Unilever – Vlaardingen, The Netherlands
Rheological Measurements on Non-Newtonian Fluids Using a Process Compatible MRI – Michael McCarthy, University of California at Davis, Davis, CA USA
Session: Quantitation Applications 2
Session Chairs: John Edwards, Process NMR Associates and Kathleen Farley, Pfizer, Inc.
High Precision Purity Determination by qNMR – How to Achieve an Uncertainty of Measurement of 0.15%? – Torsten Schonberger, Federal Criminal Police Office (“Forensic Science Institute” (Bundeskriminalamt, BKA) Wiesbaden, Germany
Process Analytical Applications of Quantitative Online NMR Spectroscopy – Michael Maiwald, BAM, Federal Institute for Materials Research and Testing, Berlin, Germany
The entire scientific program for the conference can be found here – PANIC Scientific Program

Practical Applications of NMR in Industry Conference (PANIC) – Student Travel Grants Available

CASSS is pleased to provide a limited number of student travel grants for PhD students and post-docs who present posters at the Practical Applications of Nuclear Magnetic Resonance Conference (PANIC). PhD students or post-doctoral fellows conducting research with professors in universities throughout the world are eligible.
CASSS would like to gratefully acknowledge the Suraj Manrao Student Travel Science Fund for their contribution to subsidize one additional science student to attend the PANIC Conference.
To apply for a student travel grant, students should submit:
Your abstract online (Please click here to submit your abstract)
A letter requesting consideration for the grant
A letter of recommendation from your professor or advisor
A PDF of your abstract
A CV for the candidate
All documents can be emailed to the NMR Symposium Manager, Linda Mansouria at lmansouria@casss.org. The deadline to apply for a student travel grant is Friday, July 13, 2012.

Newsflash: For Immediate Release – Process NMR Associates and Quantum Tessera Enter into Strategic Partnership

Process NMR Associates, LLC, Danbury, CT and Quantum Tessera Consulting, LLC, Collegeville, PA, USA
Process NMR Associates, LLC (LLC) and Quantum Tessera Consulting, LLC are pleased to announce they have entered into a Strategic Partnership. This partnership will leverage PNA’s experience applying magnetic resonance techniques to such processes as reaction monitoring, active ingredient quality control, and the petroleum industry. PNA’s MR expertise extends into time-domain NMR, low field high resolution NMR (60MHz and 300MHz) applications, and chemometrics. Quantum Tessera brings its knowledge and experience about large molecule process development. Together, Process NMR Associates and Quantum Tessera can deliver higher value to clients process and manufacturing problems.
Process NMR Associates and Quantum Tessera’s first project will be focused initially on NMR-based solutions for bioprocess monitoring and biofuel manufacture.
Dr. John Edwards, Principal and Manager of Analytical Services at PNA comments, “The combination of Quantum Tessera Consulting and PNA will allow both companies to expand their customer base and allow them to offer a wider range of robust and innovative solutions to our clients.”
Dr. Edward Zartler, CSO of Quantum Tessera, adds, “Process NMR associates has always led the field in NMR-based process analytics. This Strategic Partnership will result in synergies between our two companies, where the sum will be greater than the individual parts.”
About Quantum Tessera Consulting, LLC (http://www.quantumtessera.com): Quantum Tessera provides complete analytical solutions to its clients. While focused on NMR-based solutions, Quantum Tessera is focused on delivering the most appropriate solution to its customers. Quantum Tessera is focused on two major areas: Fragment-based Drug Discovery (FBDD) and Bioprocess Development.
About Process NMR Associates, LLC (http://www.process-nmr.com/): Process NMR Associates provides 1) 300 MHz analytical NMR services and consulting, 2) sales and marketing of the Aspect Italia 60 MHz high resolution NMR systems for process analytical and laboratory applications, and 3) marketing, sales, and applications for the Cosa-Xentaur SpinPulse TD-NMR spectrometer series.

Tuesday, May 15, 2012

60 MHz NMR of Essential Oils from Benchtop System – Comparison to 300 MHz NMR Data

A comparison of the non-spinning 60 MHz NMR data compared with that obtained on a superconducting 300 MHz system are shown below for 10 Essential Oils – those essential oils are: Copaibo Balsam, Dill Weed, Citronella, Parsely Seed, Cinnamon Leaf, Balsam (Peru), Ginger, Eucalyptus Globulus, Petitgrain, Vetiver.

Copaibo Balsam NMR Analysis

Dill Weed Essential Oil - NMR Analysis
Citronella Essential Oil - NMR Analysis
Parsley Seed Essential Oil - NMR Analysis
Cinnamon Leaf Essential Oil - NMR Analysis
Balsam - Peru - Essential Oil - NMR Analysis
Eucalyptus Globulus - NMR Analysis
Ginger Essential Oil - NMR Analysis


Petitgrain Essential Oil - NMR Analysis


Vetiver Essential Oil - NMR Analysis

We currently have a database of 1H (60 and 300 MHz) and 13C NMR data of around 110 essential oils.
For further details on NMR analysis of essential oils please contact John Edwards

Chevron Installs Low Field NMR Application: 31P NMR Analysis of Phosphoric Acid Strength in Alkylation Process

News Flash: Chevron purchases high resolution 31P NMR system for at-line analysis of a phosphoric acid catalyzed alkylation process.

The Chevron Richmond Refinery needed a simple and quick measurement of phosphoric acid strength and quality. Prior analysis procedures included transporting samples several miles from the refinery process to the technical center in order to perform the 31P NMR analysis on a high field superconducting NMR system. This process was also complicated by the fact that the process operators were not able to perform the analyses on the conventional high field NMR systems (400 MHz for 1H, 161 MHz for 31P) themselves, but had to wait for NMR technician and instrument availability. If sample analyses was required after research facility working hours the NMR lab technicians were required to come in and run the NMR for the process operators.

A simple permanent magnet bench-top NMR system has now been placed in the existing process lab adjacent to the process unit control room. The NMR samples are placed in specially designed 9 mm (diameter) x 50 mm (length) sample tubes in order to accommodate sample handling issues (high viscosity sample with no solvents being added) and are place easily into the NMR probe. Sample preparation is essentially non-existent and sample waste is minimal. The 31P NMR analysis itself takes around 3 minutes to perform.

The “at-line” NMR system is a high resolution Qualion permanent magnet system operating at 58.3 MHz for 1H and 24.2 MHz for 31P. The system is located on a lab bench in the process lab building. Some examples of the system performance are shown along with the comparison with high field NMR results. It can be seen that the lower field instrument provides more than adequate resolution to perform the acid strength analysis.
31P NMR - Orthophosphoric Acid
Figure 1: 31P NMR of 85% Phosphoric Acid

Figures 1 and 2 show quantitative 31P NMR spectra of different phosphoric acid concentrations dissolved in water. The NMR analysis is found to be fully quantitative.

31P NMR of Different Concentrations of H3PO4 in Water - At-Line NMR

Figure 2: 31P NMR signal acquired at 24.2 MHz on several concentrations of phosphoric acid in water.
Figure 3 shows the 31P NMR data obtained at 7 Tesla (121 MHz) and 1.4 Tesla (24.2 MHz) of actual process samples. The peak at 0 ppm corresponds to orthophosphoric acid, the peak at -15 ppm corresponds to the terminal P atoms of a polyphosphoric acid chain, and the peak at -30 ppm corresponds to internal P atoms in the middle of polyphosphoric acid chains. Relative areas of these peaks are used to calculate the acid strength.
31P NMR - Phosphoric Acid Strength - At-Line Assay

Figure 3: High field and low field 31P NMR spectra of Used Phosphoric Acid from Alkylation Process

Used Phosphoric Acid - At-Line 31P NMR Analysis

Figure 4: 31P NMR spectra and calculated acid strengths obtained on 3 different used phosphoric acid samples

Used Phosphoric Acid - At-Line 31P NMR - Acid Strength Assay

Figure 5: Another comparison of 7 Tesla laboratory acquired NMR data compared to rapid at-line 1.4 Tesla NMR assay of phosphoric acid strength.

The NMR system being utilized at the Chevron Richmond refinery is a Qualion 60 MHz NMR system utilizing a 31P probe.

For further details or to discuss your own NMR applications please contact Paul Giammatteo (Tel: +1 203-744-5905)

Whole Leaf Marker and Maltodextrin in Aloe Vera Raw Materials – Dry Weight Quantity – Extended 1H NMR Analysis Method

Process NMR Associates has developed an extension of its 1H NMR analysis of Aloe Vera raw materials and products analysis. Powder aloe vera raw materials (100x/200x) can be analyzed directly and juice samples (1x, 5x, 10x, commercial products) must be freeze dried for this analysis. The whole leaf markers utilized in this test to indicate the presence of whole leaf material are iso-citrate and iso-citrate lactone which are formed in the green leaf part of the aloe plant as part of the citric acid cycle. It is possible to assign and quantify the following components of an aloe vera juice or powder:

* aloe vera components: acemannan, glucose, malic acid
* whole leaf markers: isocitrate, iso-citrate lactone, citric acid
* degradation products: lactic acid, acetic acid, fumaric acid, pyruvic acid, formic acid, succinic acid, and ethanol
* adulterants: maltodextrin
* preservatives: sorbate, benzoate
* additives: sucrose, fructose, glycine, flavorants (contain ethanol and propylene glycol)

For the components above it is possible to obtain a wt% of that component in a juice sample – the freeze drying process is then used to determine the wt% solids in the juice and the dry weight concentrations of the organic components in the solids.

Currently testing of aloe vera raw materials revolve around acemannan and whole leaf marker content and the presence of glucose. Process NMR Associates method can perform this analysis but also tell you the “quality” of the aloe vera raw material – the absolute concentrations of degradation products can tell you a lot about the exposure of the raw material to:

* excessive heat (hydrolyzation of acemannan acetyl groups to acetic acid (vinegar) or formic acid)
* lactobacillus bacteria (found on the skin of the aloe vera plant – these bacteria “eat” malic acid and produce lactic acid)
* enzymatic processes (enzymes found in the aloe vera plant itself can cause degradation to succinic acid or fumaric acid

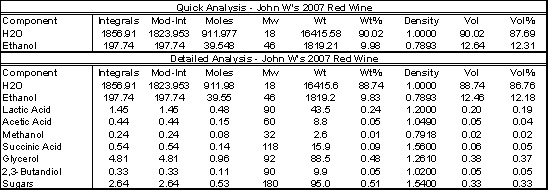
The figure below shows the NMR assignment of a whole leaf juice that has been freeze dried. From the molar ratios of the various 1H NMR peaks it is possible to obtain a wt% value for all components by comparison with a nicotinamide internal standard (spectral range not shown) and the molecular weight of the component molecule or monomer unit.

Whole Leaf Marker and Adulteration Analysis of Aloe Vera Raw Materials

1H NMR spectroscopy observes signals from all protons in the sample simultaneously. Aloe vera components, preservatives, and degradation products yield peaks at specific chemical shifts which can be integrated and quantified. Observations are made on the following peaks:

Nicotinamide – Internal NMR Standard: 1) 8.85 ppm, 2) 8.2 ppm (often coincides with formic acid), 3) 7.55 ppm, 4) 8.65 ppm
Glucose – C1 proton for alpha conformation at 5.2 ppm (doublet) and C1 proton for beta conformation at 4.6 ppm (doublet)
Malic Acid – CH at 4.35 ppm (multiplet), CH2 at 2.4-2.8 ppm (multiplet)
Acemannan – CH3 resonances of acemannan acetylation – fingerprint distribution of methyl resonances from 2.0-2.2 ppm
Lactic Acid – CH3 Peak at 1.33 ppm (doublet)
Acetic Acid – CH3 peak at 1.92 ppm (singlet)
Succinic Acid – 2 x CH2 peak at 2.5 ppm (singlet)
Formic Acid – Aldehyde Resonance at 8.2 ppm (singlet)
Ethanol – CH3 peak at 1.18 ppm (triplet)
Pyruvic Acid – CH3 peak at 2.35 ppm (singlet)
Citric Acid – 2 x CH2 resonances at 2.4 to 3.0 ppm (multiplet)
Iso-Citrate (Whole Leaf Marker) – CH at 4.25 ppm (doublet)
Iso-Citrate Lactone (Whole Leaf Marker) – CH at 5.05 ppm (doublet)
Benzoate – ortho-protons (2H) give peaks at 7.8 ppm.
Sorbate – CH3 peak is observed at 1.77 ppm (doublet) olefin protons observed at 5.7, 6.15, &7 ppm.
Fumaric Acid – CH peak at 6.55 ppm (singlet)
Sucrose – C1 proton observed at 5.4 ppm (doublet)
Maltodextrin – qNMR protons observed at 5.4 ppm
Maltodextrin is readily observed and quantified by 1H NMR – in the figure below is an example of a 100x and a 200x aloe vera gel powder – the 100x sample contains 50 wt% maltodextrin – the peaks at 5.4 and in the 3.5-4.0 ppm region are used to quantify the presence of maltodextrin.

Maltodextrin Adulteration - 1H NMR Test -  Aloe Vera Raw Material Testing

Process NMR Associates is currently the only company providing a detailed breakdown of the components of aloe vera including quantitation of the whole leaf markers. Dry weight limits of acemannan, whole leaf markers, and maltodextrin are required for aloe vera raw material certification and quality control.
In the food industry it is found that most fruits, beverages, and dairy products contain a complex mixture of these same organic acid chemistry components. 1H NMR has a unique advantage in the analysis of these types of materials as NMR requires very little sample preparation and the data can be used to unequivocally identify the presence of single component chemistries and to quantify their presence in a single 15-30 minute analysis. Process NMR Associates are available to develop NMR based methodologies on any of these types of food systems and would welcome discussion of this with potential customers. Customers are not charged for initial consultation and project scoping. These NMR methods are universally applicable on NMR systems from 200-900 MHz.

If you are interested please contact John Edwards (Tel: +1 (203) 744-5905)

Cryogen-Free NMR – High Resolution Permanent Magnet Systems – The Market Hots Up

It is interesting times in the world of NMR – there are a number of new permanent magnet NMR systems hitting the market. I have seen a number of announcements appearing on LinkedIn and other sites in recent days and then there was a question asked about Cryogen-free NMR systems on the AMMRL server. There is a little confusion out there about who is doing what and what these newer NMR systems are capable of. We (Process NMR Associates and Aspect Italia) have been in the market with a high resolution 60 MHz system (3, 5, or 10mm sample tube) since 1997. Anasazi Instruments have been quitely selling hundreds of 60 and 90 MHz FT-NMR systems based on refurbished or newly manufactured Varian EM-360 and EM-390. New to the scene and making a splash with their marketing campaigns are Picospin (300 micron sample tube, 45 Mhz), Nanalysis (3, 5mm sample tube, 60 MHz). Finally, there is a system from Magritek/ACT (5mm sample tube, 42.5 MHz) that has been re-packaged and is now out there in the world. These systems all produce spectra and can be used in the traditional manner that current supercon systems are utilized. Time-Domain (TD) NMR systems should not be confused with these platforms – TD-NMR spectrometer manufacturers include Cosa-Xentaur, Bruker, Oxford Instruments, SpinLock, MR-Resources – which are used typically for hydrogen content, rheology, simple phase measurements (solid fat, water in oil, oil in water, porosity measurements utilizing relaxation analysis.

For the past 17 years we have been actively developing applications for permanent magnet systems shimmed to approximately 3 Hz at peak half height. The current magnet technology is in its third generation of development and the magnets are built by Aspect Italia and subsidiary of Aspect Imaging who are making an impact with their industrial and clinical MRI systems (Aspect is also working in collaboration with Bruker on their Icon MRI system). The new magnet design is robust and readily shims to 1-2 Hz at half height using 5 or 3 mm NMR tubes. 3 Hz at half height is possible for 10 mm NMR tubes. In the past the focus was in on-line applications in refining and petrochemical and lab systems were not actively marketed. With the third generation of NMR instrument it is time for these robust, non-cryogen, permanent magnet systems to be applied in laboratory and general quality testing applications.

In our laboratory we have an application development advantage in that we have high field 300 MHz NMR systems that are active in commercial NMR analysis and in high field method development. We also have ESR, FTIR-ATR, GC, moisture measurements, and other instruments that we can bring to bear on applications. We can readily develop 60 MHz applications using the 300 MHz NMR data as the basis set to provide primary parameters for analysis or to answer questions about the spectral overlaps that inevitably occur in 60 MHz data sets where 1 ppm on the spectrum axis represents only 60 Hz rather than 300 Hz. When a high field NMR spectroscopist observes a data comparison of spectra obtained at 60 MHz to the same spectrum obtained at 300 MHz (a resolution that most are familiar with) the penny suddenly drops concerning the possibilities that exist for NMR analysis at this field and an appreciation for the work that was performed for the first 30 years of NMR technology on 40 and 60 MHz CW NMR’s. We have become accustomed to our big supercon magnets and have forgotten what can be accomplished at 60 MHz. In these days of powerful computers for multivariate analysis and the ability ot perform global spectral deconvolution (GSD) the ability to develop killer-apps for bench-top, at-line, or in-line applications of 1H/31P/19F/23Na/11B NMR for 110V powered systems is here. The application of chemometrics and GSD at 60 MHz can allow the lower resolution issue of peak overlap to be overcome.

In the past few days I have been “playing around” with the two Aspect systems we have in our lab – comparing spectra obtained on our 300 MHz systems to the same samples on the 60 Mhz systems. Direct comparisons of the data make you realize that though the resolution isn’t anywhere near the same – the information is present in the 60 MHz spectrum. In the links below I have included a number of PDFs showing comparisons of complex essential oil spectra, fish oil and vegetable oils (looking at omega-3 fatty acid content), polyurethane adhesive polymers, shale oil, gasoline and a spectrum of Poloxamer which is a oxyethylene-oxypropylene copolymer utilized in the pharmaceutical industry that has an NMR based USP/NF method associated with it to determine the oxyethylene content.

Polyurethane Polymers – 60 MHz vs 300 MHz – PDF
Essential Oils – 60 MHz vs 300 MHz – PDF
Fish Oils and Seed Oils – Omega-3 Content – 60 MHz vs 300 MHz – PDF
Poloxamer Analysis – Shale Oil and Gasoline Analysis – 60 MHz vs 300 MHz – PDF


Aspect Italia - 60 MHz Benchtop Laboratory NMR system

Process NMR is actively involved in development of NMR applications utilizing 60 MHz or 300 MHz NMR data. We can develop applications for you and also provide the robust, proven instrumentation that can make affordable, cryogen-free NMR analysis a common automated laboratory tool. We are also looking to prove the utility of this excellent technology in all industrial sectors – if you have an application and would like to see a feasibility study we would be happy to provide such an opportunity. We have NMR systems looking for things to do! Please contact us if you feel you have an application where NMR may provide an answer through direct measurement or chemometric calibration. We are also interested in developing multi-spectroscopy technique data fusion applications where NMR and IR are combined to provide “better answers”.

The Power of MestReNova Data Processing and Analysis Applied to 60 MHz 1H NMR Real Time Reaction Monitoring

The data analysis capabilities of the MestReNova NMR software makes processing and analyzing complex reaction mixture data a snap! Stacked plots are quick and easy and the integration routines rapidly process the peak areas into reaction profiles. Further steps allow the exponential fitting of the reaction profiles to yield kinetic information. Here are a few examples of the data visualization and rapid reaction profiling on a 60 MHz 1H NMR series obtained every 10 seconds (1 pulse) over the course of 25 minutes – the reaction is the esterification of tert-butanol with acetic anhydride in the presence of acid.

1H NMR Superimposed Plot  - Reaction Monitoring

Figure 1: Stacked Plot of the Aliphatic Region of the Spectrum with Reaction Chemistry Protons Identified
Stacked Plot - 1H NMR Spectra - Reaction Monitoring

Figure 2: Stacked Plot – Full Spectrum – Reaction Monitoring – 146 Spectra – 10 Seconds Apart
Stacked and Angled Stacked Plot - 1H NMR - Reaction Monitoring
Figure 3: Angled Stack Plot – Acetic Anhydride and tert-Butanol – Real Time Reaction Monitoring by 1H NMR at 60 MHz
Whitewashed Stacked Plot - 1H NMR Spectra - Aliphatic Region - Reaction Monitoring
Figure 4: Stacked and Whitewashed Plot of 1H NMR data at 60 MHz – Real Time Reaction Monitoring of Acetic Anhydride with tert-Butanol


Integrated Stacked Plot with Reaction Profiles Obtained from MNova Data Analysis

Figure 5: Data Analysis Tool and production of reaction profiles.

The MNova data analysis tools allow the user to integrate NMR reaction peaks and automatically plots and fits them to exponential time constants allowing detailed kinetics to be extracted rapidly and easily from the data. What used to take hours of lining up ascii spectra in excel or other software now literally takes seconds. The integration is segmented in such a manner that integrals can be made to track with shifting resonances, for example labile protons effected by pH.

The AspectItalia 60 MHz NMR system allows real time analysis of reactions with high S/N on single pulses. half height linewidths of 1-2 Hz (15-30 ppb) are possible on static reaction setups and 2-5 Hz (30 – 80 ppb) are possible with flowing reactions at rates of 1-20 ml/min.

Monday, July 20, 2009

NMR Blog Posts 2008-2009

NMR Analysis of Vinegar for Authentification and Detection of Adulteration

Over the past few years balsamic vinegars have been the subject of a number or NMR studies to determine authenticity, degree of aduleration, and age. 1H NMR has been used to quantify the relative concentrations of a series of organic components (ethanol, fructose, glucose, acetic acid, succinic acid, lactic acid, butandiol, etc (ref 1). 13C NMR has been used to determine the aunthenticity and degree of adulteration (ref 2) as well as the length of the ageing process that a given sample has undergone. Also the formation of glucose and fructose acetates during maturation and ageing has been studied by 1H and 13C NMR.

Refs.
1) Caligiani et al., Anal. Chim. Acta, 585 (2007) 110-119
2) Consonni et al., Talanta, 75 (2008) 765-769
3) Consonni et al., Anal. Chim. Acta, 611 (2008) 31-40
4) Consonni and Caligiani, Talanta, 73 (2007) 332-339
5) Cirlini et al, Food Chemistry, 112 (2009) 51-56

The concentration and distribution of the organic components has been found to correlate well with ageing process analysis, identification of adulteration, and determination of authenticity of traditional balsamic vinegars and balsamic vinegars of Modena.
Below are a series of spectra showing what can chemistry can be quantified in the balsamic vinegars as well as a few comparative spectra of apple cider vinegar and malt vinegar.


3 Comments


NMR Analysis of Commercial Pear Cider

For comparison with the home made ciders analyzed in the previous posting I am including the NMR of analysis of a commercial pear cider. The previous ciders were very dry while the pear cider was decidedly sweet. The carbohydrate content is a notable difference. The 1H spectrum is shown with chemical components identified.

No Comments


1H NMR Analysis of Hard Apple Cider

There have been quite a lot of NMR studies centered around apple cider (non-alcoholic) and apple cider vinegar. However a search of the literature turns up no reference for NMR analysis of hard apple cider. This effort was undertaken to analyse the alcohol content of the ciders and to determine the malic and acetic acid content. Ciders were produced by Dr Tim McMahon of Orange Community College, NY….for his own consumption.

Below are the NMR spectra obtained by regular 1H acquisition and with BINOM solvent suppression.

Data was obtained on our Varian 300 MHz spectrometer. Samples were prepared by degassing followed by addition of 1 drop of D2O as lock solvent.

Hard Cider #1 - NMR Analysis - Full Spectrum
Hard Cider #1 - Expansion NMR
Hard Cider #1 - Detailed Chemistry - 1H NMR
Hard Cider #2 - 1H NMR
Hard Cider #2 - Detailed Chemistry - 1H NMR

3 Comments


Micro-ESR Spectrometry of Crude Oils

Process NMR Associates, LLC (Danbury CT) and Active Spectrum, Inc (San Carlos CA) are collaborating in the application of micro-ESR technology to petroleum applications. The initial work has focussed on crude oils but will soon be expanded to residues and cracker feedstocks.

Five samples of crude oil were tested by Micro-ESR spectrometry. The samples were:

1. Vasconia, Magdalena Basin, Columbia (V=39 ppm)
2. Merey, Eastern Venezuela Basin, Venezuela (V=303 ppm)
3. Oriente, Oriente Basin, Ecuador (V=65 ppm)
4. Qua Iboe, Agbada Formation, Niger Delta (V=2 ppm)
5. Basrah Light, Zubair Zone, Iraq (V=29 ppm)

The following spectra were observed:

Micro-ESR Spectra of Crude Oils

Figure 1: Micro-ESR Spectra of Crude Oil

The central peak is a combination of a persistent carbon-centered organic radical (g = 2.003) found in asphaltenes, and a vanadyl (VO2+) peak. The additional smaller peaks are associated with vanadyl only.

For producers, the technique could be used to rapidly measure asphaltene concentration on-line. The spin density of the organic radical is a function of the maturity of the oil and will of course vary between deposits. Notwithstanding, rapid electronic measurement of asphaltenes remains a topic of great interest. Similar techniques have also been used to assess the quality of coals. For refiners, vanadium is a contaminant that poisons the refinery catalyst. ESR has been used by refiners since 1962 to rapidly measure vanadium content in crude oil feedstocks both on-line and in laboratories. Active Spectrum Inc.’s Micro-ESR is shown below. It is 2.25″ in diameter by 2.5″ high. Power input is 12-30VDC, and the data interface is USB. The device is available as either an on-line sensor or as a benchtop unit.

Micro-ESR Probe/Magnet Assembly

Figure 2: Micro-ESR Sensor

Higher resolution ESR spectrum of Merey Crude Oil

Figure 3: Higher Homogeneity Spectrum of Merey Crude

Micro-ESR is complimentary to NMR in that it observes paramagnetic metals and organic radicals which are unobservable by NMR. The stable free radical signal is indicative and quantitative to the amount of asphaltenes in the crude oil sample and vanadium metal content is an important processing parameter for cracking processes as it is active in the passivation of catalysts. NMR on the other hand observed the detailed hydrocarbon chemistry of the sample and yields chemico-physical parameters such as aromaticity, paraffinicity, naphthenicity, distillation, density, PAH distribution. In combination these two technologies yield a detailed picture of the petroleum materials before and during the refining process.

Samples provided by John Edwards of Process NMR Associates, LLC. Micro-ESR analysis provided by James White of Active Spectrum, Inc,

Active Spectrum Inc Logo
Active Spectrum, Inc. 110 Glenn Way #15, San Carlos, CA 94070 650-610-0720 | 626-628-1970 f |activespectrum.com

Process NMR Associates, LLC Logo
Process NMR Associates, LLC. 87A Sand Pit Rd, Danbury, CT 06810 203-744-5905 | 203-743-9297 f |process-nmr.com

PDF Version of Application Note

For more information contact John Edwards (203) 744-5905

7 Comments


Residual Catalytic Cracking (RCC) – Feedstream Analysis by NMR

Current Technique for Feedstream Analysis:
Analysis Performed – Refractive Index, Distillation, Specific Gravity
Calculation Obtained – Watson K-Factor
Outcome: aromatic carbon number, aromatic hydrogen number, total hydrogen content
Proposition: Detailed hydrocarbon analysis for kinetic model development.

Our experience is that an improved and useful analysis can be obtained from NMR
analysis. There are several ways to approach the NMR analysis and the
chemometric approach to correlating NMR data to physico-chemical parameters of
use to process control.

RCC Feedstream Analysis by 1H and 13C NMR: Multivariate Prediction of Chemical and Physical Properties

Presented at the 236th ACS National Meeting, Philadelphia PA, August 17-21, 2008

John C. Edwards Ph.D.
Process NMR Associates LLC
87A Sand Pit Rd, Danbury, CT 06810

Jincheol Kim,
SK Energy Co., Ltd, SK Energy Technology Center,
140-1, Wonchon-dong, Yuseong-gu, Daejeon 305-712, Korea

Summary of Slides

1) 60 MHz process NMR data available from online NMR unit.

60 MHz Process NMR Data available from online NMR Unit

2) 300 MHz 1H NMR data available from standard NMR experiments on laboratory NMR system at Process NMR Associates

300 MHz 1H NMR Data - RCC Feeds

3) Expansions of 1H NMR data on RCC Feeds

Expansion of 300 MHz 1H NMR Data - RCC Feeds

4) Calculated 1H NMR Parameters Represented as an alternative “spectrum” for use in chemometric modeling and linear regression.

Calculated 1H NMR Parameters Represented as a

5) 13C NMR Data obtained on RCC Feeds

13C NMR Data  - RCC feeds

6) Expansions of 13C NMR Data

Expansions of 13C NMR Data - RCC Feeds

7) 13C NMR and Average Molecule Parameters Calculated from 13C Spectrum

13C NMR - Calculated Parameters

8) Calculated 13C NMR Parameters Represented as an alternative “spectrum” for use in chemometric modeling and linear regression.

13C NMR Parameters Represented as a

9) Correlations of Spectra and Calculated Parameters to Physico-Chemical properties of RCC Feeds

Correlations of Spectra and Calculated Parameters to Physico-Chemical Properties of RCC Feed

10) Correlation of Spectra and Calculated Parameters to Density

Correlation of Spectra and Calculated parameters with Density

11) Variable Selection for Linear Correlation of Calculated NMR Parameters to Physico-Chemical Properties of RCC Feeds.

Variable Selection for Linear Correlations

12) Correlation of Calculated 13C NMR Parameters (C-Type and Average Molecule) with both high resolution 1H and 13C NMR spectra. Models created can be utilized by personnel with no NMR experience to calculate NMR parameters directly from the spectrum without any prior knowledge of integrations or calculations to be performed.

Correlation of 1H and 13C NMR Spectra with Calculated 13C NMR Parameters

Summary
Chemical and Physical Properties of RCC Feedstreams can be determined
by 1H NMR (at 60 and 300 MHz) and by 13C NMR
H-Type and C-Type Parameters do not provide as good a correlation as is observed
by full spectrum regression. This is due to loss of resolved chemical shift information
when the spectrum is reduced to larger integral areas.
1H NMR can be combined with PLS regression modeling to provide detailed carbon
type analysis for RCC Feeds
Regression analysis of 13C NMR data can be utilized to fully automate the prediction
of 13C NMR type analysis : reducing the necessity for considerable knowledge and
analysis time on the part of the analyst.

For further Detail Contact John Edwards

1 Comment


Diesel Production Control – Combination of NMR and Simulated Distillation to Yield On-Line Carbon Number Distributions

Process NMR Associates has developed a database of Simulated Distillation database on a large number of diesel fuels on our Shimadzu 2010-GC with SimDis Software. The analysis is being used to develop distillation prediction models for the process NMR systems as well as explore new avenues of control information that can be derived by combining carbon number distributions obtained from the GC data with the predictive capabilities of online NMR.

For a PDF version of this application article download this: Combination of NMR and Simulated Distillation for Diesel Production Control
NMR and SimDis - Diesels
SimDis of Diesels
Carbon Number Distribution by SimDis - Diesel
SimDis and NMR - Diesel #1
NMR and SimDis - Diesel #2
NMR and Simulated Distillation - Diesel #3
SimDis and NMR - Diesel #4
NMR and SimDis - Diesel #5
NMR and SimDis - Diesel #6
SimDis and NMR - Diesel #7
SimDis and NMR - Diesel #8

Simulated distillation allows carbon number distributions to be calculated and in combination with chemistry observed in the NMR analysis the effect of aromatics and olefins on the paraffin distributios can be estimated. Online NMR predictions can be established that yield real-time carbon number distributions for production control and sulfur species monitoring.

Contact: Paul Giammatteo Tel: +1 (203) 744-5905

Process NMR Associates Website

2 Comments


Extensive NMR Diesel Database Enhances NMR Model Performance for Unit Control and Product Manufacturing

An extensive database (10 years) of diesel samples incorporating all refining processes (distillation through product blending) enables development of robust, wide ranging property predictions independent of crude sources and refinery processing. Consistent attention to data integrity enables expanding model ranges well beyond any typical single unit or process operation. The following slides elucidate the consistency in spectra whether obtained 10 years ago or last week, from within a refinery or on a laboratory spectrometer.
NMR of Diesel
NMR - Aromatic Region of Diesels
NMR- Aliphatic Region of Diesel
Hydrotreated Diesels - NMR
Diesel Distillation Model - T50 (F) NMR
Diesel Distillation model - T50 (C) - NMR
Diesel Distillation Model - T90 (F) - NMR
Diesel Distillation Model - T90 (C) - NMR
Diesel Flash Model - NMR
Diesel Cloud Point Model - NMR
Diesel T50 Model Online Performance - NMR- 3 Weeks
Diesel Flash Point Model Online Performance - NMR - 3 Weeks
Diesel Cloud Point Model Online Performance - NMR - 3 Weeks
NMR - Diesel Production Control Scheme

If you are interested in finding out more about NMR and diesel production control contact Paul Giammatteoor phone him at +1 (203) 744-5905 – see the Process NMR Associates website for further information

2 Comments


Quantitative NMR Analysis of Wine – qNMR

Here is an example of a 1H NMR analysis of a 2007 Red Wine submitted for chemical analysis by John W.

1H NMR Spectrum - Quantitative Analysis of Wine

1H NMR of Wine - Detailed Component Breakdown

NMR Analysis - Quantitative Component Calculation

If you are interested in wine analysis please contact us.

1 Comment


Solid-State 13C NMR Analysis of Carbonaceous Materials

Over the past 20 years we have obtained the solid-state NMR analysis of pretty much every carbonaceous material that exists – including coal/oil shales/bitumen, polymers/catalysts/fibers, cellulose/polysaccharides/foodstuffs/gels, deposits/dried sewage/meteorites/soils/clays, etc. With the increased attention to coal liquifaction and gasification technologies we have developed an interest in creating an NMR database for coals. Coals were obtained from the Penn State Coal Sample Bank at a very reasonable cost. We have performed CP-MAS, DD-MAS, Variable Contact Time, and T1 inversion recovery experiments on all the samples. We are currently developing regression relationships between the NMR data and the physical and chemical testing data that is provided with the samples. At some point we will write this up as a journal article. Here are some snippets of data from the coal analysis along with a few results obtained on the menagerie of samples we look at on any given day including some oil shales, engine deposits, refinery coke, asphaltenes, and pipe tobacco.

Solid-State 13C NMR - Illinois #6 Coal

Solid-State 13C NMR - Hiawatha Coal

Solid-State 13C NMR - Coals: Rosebud and Dietz

Solid-State 13C NMR - Engine Deposits: CCD and IVD

Solid-State 13C NMR - Refinery Coke

Solid-State 13C NMR - Arab Medium Heavy Asphaltene

Solid-State 13C NMR - Pipe Tobacco

Please inquire if you are interested in the details of the above analyses.

1 Comment


60 MHz TD-NMR System

Process NMR Associates and Spin Resonance Ltd have recently completed the construction a small 60 MHz (1.4T) 5mm TD-NMR system that can be utilized to study T1 and T2 characteristics of novel contrast agents at typical MRI frequencies. Here are a few pictures of the magnet. It is based on N42 neodymium-iron discs (120mm diameter x 30 mm deep).

60 MHz NMR Console - Hahn Echo

60 MHz NMR - CPMG

60 MHz NMR - T1 - 90-90 Experiment

60 MHZ NMR Magnet with 5 mm Probe

60 MHz TD-NMR Magnet

1 Comment


Process NMR Application: Spectro-Molecular Control for Enhanced Diesel Recovery

NMR Process Systems – Integrated Solution

Application for Crude Unit and Downstream Processes:
Spectro-Molecular Control for Enhanced Diesel Recovery

NMR Process Systems (NPS) on-line NMR based analytical and process control strategy for enhanced diesel recovery at the crude distillation unit maximizes clean diesel recovery by enabling closer cut point control in the mid-section of the CDU.

Clean Fuels regulations in both the European and American markets have had a substantial impact on a refiners ability to maximize product draws at the refinery front end. Extremely low sulfur requirements for gasoline and diesel have resulted in refiners now being more constrained at the hydro-treaters. Lack of reliable, focused, measurement and control of critical CDU product draws has forced many refiners to significantly undercut these draws in order to ensure minimum error in the final product blends, especially with respect to total sulfur. Depending on a refinery’s crude supply and CDU capacity, a conservative estimate of 300-500+ barrels per day of loss diesel production is typical. With an average of $25-$35 per barrel margin loss, the economic impact of these Clean Fuels Regulations are substantial.

Integrating proven NMR technology with a focused measurement and control strategy enables crude unit operations to cut chemically closer to the hydrotreater constraint limit. The strength of NMR is that it quantitatively and accurately observesthe chemistry of each refinery stream and readily relates that chemistry to chemically dependent parameters such as distillation, cetane, freeze points, etc. The NPS strategy is to cut and control CDU diesel production as closely to the dibenzothiophene distillation limit as possible. Figure 1 illustrates this strategy in terms of both current and proposed NMR based measurements.

Figure 1: Overall NMR measurement and control outline highlighting measurement/control strategies.

Enhanced Diesel Recovery

Let NMR Process Systems deliver Spectro-Molecular Control to your refinery so that you can achieve real economic and production benefits.

3 Comments


Process NMR Associates – Archives – Gasoline Analysis by NMR and Chemometrics – ENC 1996

Just came across an old presentation on gasoline analysis by NMR and chemometrics with direct comparisons to Mid-IR and NIR. Presented at the Experimental NMR Conference in March 1996….PDF (3 MB)

No Comments


Conjugated Diolefins Analysis by COSY NMR

Conjugated diolefins are responsible for fouling of many processes in a refinery. COSY NMR analysis can determine the concentration of these species in many processed petroleum product streams….see PNA webs site.

Conjugated Olefins by COSY NMR - 1D 1H NMR - Coker Naphtha

Conjugated Olefins by COSY NMR - COSY - Coker Naphtha Showing Conjugated Olefin Signals

Conjugated Olefins by COSY NMR - Hydrotreated Naphtha

Conjugated Olefins by COSY NMR - Hydrotreated Naphtha

No Comments


Schering-Plough Corporation Seeks Process Analytical Technology Manager

Title:
Process Analytical Technology (PAT) Manager

Description:
Implement Process Analytical Technology (PAT) throughout all the Global Quality Sites to identification of incoming materials and monitor manufacturing processes.
Work directly with the sites and Schering Plough Research Institute to help support / initiate the development, validation, and deployment of PAT at the sites.
Review, evaluate, implement, and manage PAT activities.
Provide guidance / technical help to the sites to conduct evaluation and purchase commercial PAT related analytical equipment (e.g. NIR / FT-NIR, Raman / FT-Raman, IR / FT – IR etc.).
Maintain analytical instruments in the lab to comply with cGMP standards and requirements.
Train and mentor laboratory staff on PAT to generate analytical data for routine experiments.
Generate network and infrastructures with various sites of the corporation.
Take full ownership / responsibility and provide effective, meaningful, result driven and pro-active leadership on all PAT projects.
Responsible to transfer knowledge / technology of PAT related projects and activities to sites. Job is located in New Jersey.

Respectfully, Vincent L. Graziano
Recruiting Manager / Global Staffing
Schering-Plough Corporation
556 Morris Avenue, S1-1
Summit, N.J. 07901
Ph: 908-473-2745
Fx: 908-473-2793
Ph: 908-298-5232 (Kenilworth)
Careers: Employment Opportunities
email: vincent.graziano@spcorp.comÂ

3 Comments


NPS – IS : A New Approach to Process Analytical

Press Release – NMR Process Systems – Swagelok Technology Conference, Teaneck NJ -October 23, 2007

NMR Process Systems, LLC Announces : NPS-IS©NPS Integrated Solutions

NMR Process Systems (NPS) announces a new era in advanced analyzer and process control solutions for on-line and at-line process applications. NPS’s Integrated Solutions (NPS-IS©) approach is designed to take advanced on-line analysis to the next level in delivering real engineering and economic benefit to the user.

NPS-IS©: the first and original source for any and all on-line NMR applications regardless of NMR vendor.

NPS-IS©: the first to offer integrated advanced analytical solutions using multiple technologies in one box.

NPS-IS©: the first to offer a fully integrated Swagelok sampling solution for improved sample switching and reliable measurement.

Too many spectroscopic based on-line analyzer projects (FTIR, NIR, NMR) have failed to meet expectations and/or objectives due to:

·Overselling the measurement

·Underestimating the sampling requirements

·Trying to replace all traditional analyzers with one technique.

NMR Process Systems is positioned to deliver the real benefits of advanced analytical systems in petroleum, petrochemical, chemical, food and beverage and pharmaceutical applications. Moving beyond the traditional replacement analyzer philosophy, NPS-IS© integrating analyzers and advanced controls to deliver real process improvement and economic benefit. Such integration leverages the strength of any individual spectroscopy, shortens per stream analysis time, and builds in internal cross-checking to ensure accuracy.

For more information contact Paul Giammatteo Principal, NMR Process Systems

87A Sand Pit Rd, Danbury, CT 06810 U.S.A. Tel: (203) 744-5905

4 Comments