Silicon-29 NMR has a unique ability to probe the detailed solid state chemistry of silicone rubber materials. The chemical shift range of the various silicone chemistry groups spans 120 ppm (at 4.9T this equates to 4800 Hz). This is a large dispersion which allows all chemistry types to be readily observed. In these, studies, however, we have not attempted to identify every chemical type present. We have identified general chemical types and followed their relative concentration from one sample to the next. Both cross polarization and single pulse experiments were performed on magic angle spinning samples (a full explanation of these two complimentary experiments is given below). Optimal experimental conditions were initially obtained and all subsequent samples have been analyzed under identical conditions to facilitate an understanding of the spectral changes from a chemistry as well as molecular mobility standpoint. Set NMR experiment conditions were used because of the time consuming nature of these experiments which typically take around 12 hours for each of the cross polarization and single pulse experiments.
Experimental
At the present time samples are being run on a Varian UnityPlus-200 spectrometer operating at a 29Si frequency of 39.74 MHz. The probe was a Doty Scientific 7 mm Supersonic CP/MAS probe using zirconia and Kel-F end caps. For the single pulse NMR experiments a pi/6 pulse of 2 microseconds was used with a relaxation delay of 4 seconds to facilitate quicker acquisition.The 4 second relaxation delay was obatined from full T1-inversion recovery experiments. Gated proton decoupling was used during FID acquisition. For the cross polarization experiments full contact time array experiments were obtained on the initial samples submitted. Due to the mobility of the polymer backbone the optimum cross polarization contact time for the polymer backbone was around 15 ms with signal lasting until 50+ ms. However, the more rigid structures in the polymer – such as the silicates, had optimum contact times around 3-5 ms. As a compromise we chose a 6.4 ms contact time which yielded good signal sensitivity for both the polymer and silicate components. Cross polarization inversion recovery experiments yielded a short relaxation delay of 2 seconds. A 1H pi/2 pulse of 4.6 ms was used along with gated proton decouplind during FID acquisition. For all samples the same experimental conditions have been maintained. MAS spinning speeds were around 7 kHz to avoid spinning side band coincidence on real signals. Also, to avoid MAS induced modulation of the contact-time, the variable amplitude cross-polarization contact pulse was used.
Silicone Chemistry Observed by NMR
The notation in use for silicone chemistry is M,D,T,Q (mono, di, tri and quaternary) denoting the oxygen substitution on the silicon atom. The polymer backbone itself is predominantly D i.e. [(SiO2(CH3)2]n which has a typical resonance frequency around –21 ppm. The termination of the polymer would be an M group (SiO(CH3)3) (found at +4 to +10 ppm) or MOH (SiO(CH3)2OH) (-10 to –15 ppm). Another area of interest in the spectrum is the –20 to –10 ppm region which is partially due to MOH but also due to D type silicon centers that are within 5 monomer units of a termination. Thus, if hydrolysis of the silicone backbone is occuring, this region will increase in intensity as one will now have more silicon centers close to termination points as well as more MOH terminations.
In some gaskets one observes small signals in the –60 to –70 ppm region which is due to T type silicone centers (SiO3(CH3))n, however this is usually not observed. The only other region where one observes signal is in the –80 to –120 ppm region of the spectrum. These silicon centers can only be Q1 (SiO(OH)3), Q2 (SiO2(OH)2), Q3 (Si(OSi)3(OH)) or Q4 (SiO4)types, as only silicons with 4 attached oxygens can appear in this region, any methyl substitution would cause these silicons to appear in the +10 to –70 ppm range of the spectrum. Of relevance to any discussions on silicone polymers it should be noted that Q1 is equivalent to M(OH)3 , Q2 is equivalent to D(OH)2 , Q3 is equivalent to TOH.
When one looks at the NMR experiments for the certain silicones one does not observe a resonance at +10 to +4 ppm. This indicates that the predominant polymer termination is MOH. Silicate is observed, however, it is not clear if this silicate is a filler for hydrogen bonding crosslinking or actual polymer Q4/Q3/Q2 sites of directly condensed silicates acting as bonded crosslinking agents.
SP-MAS NMR Experiments
In this experiment one quantitatively observes all silicon species in the system allowing a “bulk” silicon type distribution to be calculated. One observes a narrow resonance at –21 ppm which is due to the silicone polymer backbone (-O-Si(CH3)2-O-)n. Very little signal is observed in the –20 to –10 ppm region indicating that the polymer chains are quite long. In the –80 to –120 ppm region of the spectrum one observes silicon present in silicate that has been added as a cross-linking agent. The hydrogen bonding between the silicone polymer and the Si-OH groups of the silicate add structural integrity to the gasket. It is differences in the silicate silanol (Si-OH) chemistry that may account for changes in compressibility of the gasket during service. Thus, one will observe relative changes in the amount of 29Si signal observed in the –80 to –103 ppm and –10 to –23 ppm regions of the spectrum. This region is where Q3 (Si(OSi)3(OH)), Q2 (Si(OSi)2(OH)2), and Q1 (Si(OSi)(OH)3) groups are found.
Parameters Calculated:
Silicate Content – %Si in silicate filler
Q4 - %Si atoms in Q4 silicate – Si(OSi)4
Qn – %Si atoms in Qn silicate (Q1, Q2, Q3)Q4/Qn Ratio – Silanol (Si-OH) distribution
% Polymer – %Si in D & MOH polymer units
Relative changes in these parameters can be utilized to interpret changes in silicon chemistry caused by coolant exposure and service.
CP-MAS NMR Experiments
This experiment warrants a detailed explanation as the results are not quantitative from a “bulk” silicon chemistry standpoint. The CPMAS experiment utilizes the strong NMR signal that can be generated from protons (H) in the sample. The experiment preferentially observes silicons that are in close proximity to H. However, mobility is also a “problem” in this experiment. The way the experiment works is that the protons in the sample are polarized initially and magnetization is transferred from the protons to the silicons via their dipole-dipole interaction (similar to the interaction between 2 bar magnets). This interaction weakens the further the H and Si are from each other, and also weakens if there is considerable molecular motion. In the case of these samples this means that in the silicate region of the spectrum one observes an enhancement of the signal due to Si-OH containing species. In the case of the silicone polymer, however, one observes an overall decrease in the signal at –21 ppm due to the –(O-Si(CH3)2-O-)n backbone due to its rapid segmental (rubbery) molecular motions. One observes a large signal (that is hardly observable in the SPMAS spectra) in the –5 to –20 ppm region. This is due to silicone silicons that are at or directly adjacent to crosslinking sites (where there could be a D-silicate bond, or polymer termination sites such as MOH. The fact that they are enhanced by the CP technique indicates that these termination proximate silicons are motionally restricted compared to the rest of the silicone backbone. They represent either strongly hydrogen-bonded regions or chemical crosslinks of the type (O2(CH3)2Si–O–Si-O–Silicate) where a defect in the silicone backbone has reacted with a silanol of the silicate filler to form a Si-O-Si bond. This experiment is very powerful when used to observe relative changes in Si-OH chemistry in the silicate region and relative mobility changes in the polymer backbone.
Parameters Calculated:
% polymer backbone – %Si in mobile silicone backbone
% restricted polymer backbone – %Si in motionally restricted regions of the silicone backbone (D units in close proximity to cross-linking sites, termination sites (MOH) or adjacent to termination sites).
Silicate Content – %Si in silicate filler.
Q4 - %Si in Q4 silicate – Si(OSi)4
Qn – %Si in Qn silicate (Q1, Q2, Q3)
Q4/Qn Ratio – relative change in silanol (Si-OH) distribution
As with the SP-MAS calculated parameters one can utilize these parameters to determine changes in silicon chemistry resulting from coolant exposure and service.
Table I Summary of 29Si NMR Chemical Shift Regions
Chemical Shift
Region (ppm) Species
+10 to +4 Polymer termination sites (SiO(CH3)3) M
-5 to –15 Polymer Termination Sites (SiO(CH3)2OH) MOH
-10 to -20 Motionally restricted silicone polymer. Cross-linked and H-bonded –(O-Si(CH3)2-O-)n D units within five monomer units of polymer termination(-21) D Units – motionally unrestricted silicone –(O-Si(CH3)2-O-)n
-75 to -85 Q1 Si(OSi)(OH)3 Silicate Center (M(OH)3)
-85 to -94 Q2 Si(OSi)2(OH)2 Silicate Center (D(OH)2)
-94 to -104 Q3 Si(OSi)3(OH) Silicate Center (TOH)
-104 to -120 Q4 Si(OSi)4 Silicate Center (Q)
Discussion
In use one observes that the gasket silicon chemistry changes dependent on additive chemistry and temperature/pressure conditions. When the polymers degrade one observes a general loss of D type signal intensity in the 29Si SP/MAS experiment as well as a corresponding increase in silicate content. One does not typically see changes in Q4 type but instead large changes in Q3 and Q2 content. These changes occur regardless of the presence of silicate in the coolant. This leads one to deduce that the Q3 and Q2 types are being generated by degradation of the polymer itself rather than a change in the chemistry of the silicate that was present in the sample initially. The author is not privy to additives and experimental conditions so he cannot speculate on the effect of silicate and other additives on the speed of the degradation that occurs. At the same time that Q3 and Q2 types are increasing in intensity the CP/MAS experiment clearly shows that there is a large increase in the relative amount MOH types and D types close to terminations (-5 to –20 ppm region). This proves that the exposure to coolants causes a hydrolysis of the Si-O-Si bond. However, it should also be notes that for the Q3 and Q2 types to appear one must also be hydrolyzing the Si-CH3 bonds.
The complimentary nature of the SP/MAS and CP/MAS experiments along with the use of only on set of experimental CP/MAS conditions means that relative changes in the various silicon chemistries can be analyzed to quantify the degree of degradation that a polymer has gone through.
Excellent Silicone Chemistry Link – Silicones in Pharmacutical Applications
For more information on this topic please contact:
John EdwardsManager, Process and Analytical NMR Services
Process NMR Associates LLC,
87A Sand Pit Rd
Danbury, CT 06810, USA
Tel: (203) 744-5905
Monday, February 20, 2006
Thursday, February 16, 2006
High Temperature Simulated Distillation in Petroleum Characterization February 16th, 2006
“High Temperature Simulated Distillation” by Dan Villalanti et al. in Encyclopedia of Analytical Chemistry, “Yield Correlations between Crude Assay Distillation and High Temperature Simulated Distillation” by Villalanti et al., and “Refinery Analytical Techniques Optimize Unit Performance” . All discuss the panacea of developing rapid HTSD as a suitable replacement for the very lengthy crude assay distillation.
Exxon Technology Reviews - February 15th, 2006
Residue Upgrading Technologies are discussed in severla papers including one presented in India, and another at ERTC 2004 in Prague In Moscow at the 1st Bottom of the Barrel Technology Conference a paper was presented on “Delivering Value for Resid and Heavy Feed“.
Trends in NMR Logging - Schlumberger Review Article - February 15th, 2006
Oil exploration companies are using NMR measurements in a number of downhole applications, such as characterizing formation fluids during reservoir evaluation and assessing formation producibility. In their article “Trends in NMR Logging” Schlumberger describe how NMR technology is changing the way reservoirs are designed, developed and managed. A similar paper, “Advances in NMR Logging” is presented by Robert freedman of Schlumberger.Another review was produced in 1995, and “How to Use Borehole Nuclear Magnetic Resonance” was produced in 1997.
NMR Petrophysics offers NMR logging courses and provide NMR log analysis services.
A paper on the effect of sorbed oil on 1H NMR response was published byStanford University researchers.
A book is available on the subject entitled, “NMR Logging – Principles and Applications”
“Oil-Viscosity Predictions From Low-Field NMR Measurements” by J. Bryan and A. Kantzas, U. of Calgary/Tomographic Imaging and Porous Media Laboratory, and C. Bellehumeur, U. of Calgary
Application of TD-NMR in Civil Engineering - February 15th, 2006
Practical Applications of NMR in Civil Engineering by Bernd Wolter, Frédéric Kohl, Nina Surkowa, Gerd DobmannFraunhofer-Institut fuer zerstoerungsfreie Pruefverfahren (IZFP), Saarbruecken, Germany
Book Chapter - Monitoring Thermal Processes by NMR Technology - February 15th, 2006
A neew book on Emerging Technologies for Food Processing has been published by Elsevier, edited by professor Da-Wen Sun ( National University of Ireland, Dublin) and has contribution from KVL Quality & Technology: Monitoring Thermal Processes by NMR Technology by Nanna Viereck, Marianne Dyrby and Søren B. Engelsen. (Oct 2005)
MathNMR - NYU Software for Spin and Spatial Tensor Manipulations - February 15th, 2006
Professor Alexej Jerschow has made available a Mathematica package that allows calculation of spin and spatial tensors – it is available at the following link : MathNMR.
Also available at this site are a very handy palm utility that lists frequencies, gyromagnetic ratios, natural abundances, receptivities, magnetic and quadrupolar moments, and reference compounds of most NMR active nuclei – download PalmNMR. He also provides a nicely designed interactive NMR frequency map.
Italian patent - New Pre-Saturation Methodology - PERFIDI - February 15th, 2006
Stanislav Sykora, in his NMR blog describes a recent patent applied for by himself and Paola Fantazzini, under the auspices of the University of Bologna. The patent surrounds a new pulse sequence that will allow selective excitation of components of a complex mixture based on the T1 relaxation differences between the NMR active nuclei in the components. The pulse sequence pre-amble is called PERFIDI. The Italian patent (#BO2005A000445 of July 01, 2005) is currently confidential but the invcentors have set up a website for potential licensors of the technology. The website includes a brief overview of the patent.
Thursday, February 09, 2006
NMR Processing Freeware - SpinWorks
Dr. Kirk Marat at University of Manitoba has developed (and continues to develop) and excellent NMR processing freeware package that works very intuitively and well.
The FTP link to download the software is ftp://davinci.chem.umanitoba.ca/pub/marat/SpinWorks/.
The current version is 2.5.3. There is also an excellent documentation PDF file to help users work through the program functionality.
“What is SpinWorks:
SpinWorks has two functions: The first is to provide easy basic off-line processing of 1D NMR and 2D data on personal computers. SpinWorks other function is the simulation and iterative analysis of complex second order spectra including dynamic NMR problems and certain solid-state NMR problems, in a manner similar to our UNIX Xsim program. SpinWorks 2.4 is the forth release of SpinWorks version to contain 2D processing. Full support is included for Bruker (XwinNMR/UXNMR) and Varian (Unix VNMR) data formats. Included F1 detection modes include States, TPPI, States-TPPI, Single Detection (QF), and echo-antiecho. There have also been some improvements and bug fixes in the 1D and simulation routines, and these should be at least as stable as those in version 1.3. While the program is to the point where it should (I hope) be useful, there will, no doubt, be bugs and there are things that don’t yet work. The aim of the program is to make a program easy enough for undergrads to process magnitude COSY spectra (for example) with a single mouse click, and yet still be flexible enough for research use. SpinWorks currently handles only one data set at a time. However, most new computers have sufficient memory to run two or three copies of SpinWorks simultaneously. This can be very useful when examining the rows and columns of a 2D data set.
Computer Requirements:
SpinWorks requires a 486 or higher processor (Pentium recommended) running Windows 95, 98, NT 4.0, Windows 2000 Pro, or XP (NT 4.0, XP or Win 2000 recommended). Windows ME is probably O.K., but is untested. Installation currently requires about 5 Mbytes of disk space exclusive of NMR data. 32 Mbytes or more of RAM are recommended, depending on NMR data set and simulation sizes. SVGA 800 x 600 or better display required (1024×768 or better recommended). For 2D processing a Pentium class processor with 64 Mbytes of memory is the practical minimum. For 2D you should also have your display set to at least 16 bit colour, otherwise the image and contour level colours will be strange. I have received reports (but have not confirmed) that SpinWorks will run under Linux with the WINE package and on a Mac with SoftWindows. A three-button mouse is ideal, but SpinWorks will work just fine with a two-button mouse. Note that on “Wheel Mice” the mouse wheel also serves as the middle mouse button. The mouse wheel can also be used for vertical scaling of 1D spectra.”
Some NMR Technology Patents
Process NMR Technology Patents
Qualion NMR Patents
4998976 5063934 5072732 5162734 5184078 5320103 5371464 5462054 5978694 6281775 6310480 6670877 200400114236 20050040827
Other In-Line NMR Patents
Mobility Detected NMR - 6479994 6549007 6744251 6828892
Blending Control by NMR - 5796251
Ex-Situ NMR - 20030052677
Oil-Water Emulsion Compositions by NMR - 6794864
Bitumen Content by NMR - 6630357
Mobile NMR Analyzer - 5994903
Detection of Spoilage - 5270650
Microcoil Benchtop NMR - 5654636 6097188
Control of Process by NMR Gas Analyzer - 5265635
To search and get adobe acrobat pdf versions of patents go to Freepatentsonline.com
http://www.freepatentsonline.com/#.pdf
where # is patent number without commas patent 5,265,635 is 5265635.pdf
Time-Domain NMR Spectrometers - Benchtop and Online Relaxometers
Time Domain Process NMR Spectrometers - Bench Top and On-Line Relaxometers
There are several NMR analyzers on the market that use an entirely different approach to some of the more simplistic on-line NMR applications. These spectrometers are very different from the Invensys MRA system in that they do not produce an chemical information. The Invensys MRA is a fully shimmed 60 MHz high resolution FT-NMR spectrometer that yields high resolution 1H NMR spectra which contain detailed chemical information that can be correlated with changes in chemical and physical properties. The other type of process NMR equipment is a low resolution time domain spectrometer that consists of a 1-30 MHz NMR system tied to an un-shimmed magnet. Only time domain data is acquired and relaxation time constants are calculated or correlated to physical properties or mixed phase content of mixtures.
For an overall view of NMR applied to process control or quality testing we are providing several links to papers or sites which adequately describe this "flip-side" of process NMR spectrometry.
On-Line Process NMR Relaxometry - Based on Auburn International/Oxford Instruments/Progression Technology - Polymer Qualities
The Analyst - Review Paper on Process NMR Spectrometry Covering Mainly Relaxometry Applications
Magritek - Low Field Portable and Specialty NMR Equipment
Minispec Analyzer from Bruker - Application Note Web Page
Maran NMR Analyzer from Universal Systems Inc - Applications Page
On-Line TD-NMR - Progression Inc
Applications of NMR Relaxometry - Process Control Technologies Inc
Time Domain Process NMR Spectrometers - NMR MOUSE
A handheld NMR surface analyzer is now available from Bruker or the collaborative research group that developed the technology.
NMR Mouse - Aachen Group Bruker Minispec MOUSE
Applications of NMR Mouse More Applications
Time Domain Process NMR Spectrometers - NMR Logging Tool
NMR logging tools have been developed for down-hole profiling of oil well pore structure and fluid reservoir structure and composition. This is NMR 1 mile down a hole.
Schlumberger NMR Logging Tool Description
Overview Paper - Trends in NMR Logging
Overview Paper - How to Use Down-Hole NMR
Lecture on Down-Hole NMR Logging
Compendium of Alternative Fuels Links
Alternative Fuels - General Links
Alternative Fuel Vehicle Directory
AlternativeFuels.Com
Alternate Energy Store
EPA - Alternative Fuels and Additives
Canadian Renewable Fuels Association
Scenarios for a Clean Energy Future
Center for Renewable Energy
Fuel Economy . GOV
How Does a Fuel cell Work?
Fuel Cell Information Center
Renewable Energy Magazine
A Clean Energy Future - Alberta Energy Research Institute
Federal Tax Treatment of Alternative Fuels
Alternative Fuels from Renewable Resources
Renewable biological systems for alternative sustainable energy production (FAO Agricultural Services Bulletin - 128)
Technologies for Clean Energy
Fuel Cells
US DOE Fuel Cells Program 2002 Review Meeting Reports
DOE Technical Publications
DOE General Information
DOE - Fuel Cell Related Links
Fuel Cell Today
The Business of Fuel Cells
SAE - Fuel Cell Technology Showcase
The Hydrogen and Fuel Cell Investor
Hydrogen
US DOE Hydrogen Program 2002 Review Meeting Reports
National Hydrogen Energy Roadmap
DOE Technical Publications
DOE General Information Fact Sheets
DOE Links to Organizations and Associations
DOE - Hydrogen Program Glossary
National Vision of America's Transition to a Hydrogen Economy
Hydrogen Now!
The Hydrogen Economy - Jeremy Rifkin
Hydrogen Economy Again
How Stuff Works - The Hydrogen Economy
The Coming Hydrogen Economy - Fortune
UK Parliament - Prospects for a Hydrogen Economy
Australia - State Sustainability Report - H Economy
The Hydrogen Economy in the 21st Century
Hydrogen and Fuel Cells
The Future of the Hydrogen Economy - Bright or Bleak?
European Perspectives on Facilitating the Hydrogen Economy
Shell Hydrogen Perspectives
Hydromax
Biodiesel
Biodiesel FAQ's
Biodiesel - AFDC
Biodiesel.Org
Canadian Renewable Fuels Association
Marine Biodiesel Handbook
Biodiesel Overview
Biodiesel Legislation - Final Rule
Resources on the Web
Biomass Conversion
BioFuels - DOE
Biofuels - Links
Regional Biomass Energy Program
Biomass Links from ORNL
Energy Crops
American Bioenergy Association
Biomass Conversion Technologies
Biomass Resources
Biomass Applications and Links
Biomass Sources for Industry
Advanced Processes for Biomass Conversion
Advanced Processes for Biomass Conversion to Energy
Biomass Fact Sheet
Biogas and Liquid Fuels from Biomass
Ethanol
Renewable Fuels Association - Ethanol Industry
Ethanol Marketplace
EPA Fact Sheet
Water-Diesel Mixtures
Lubrizol PuriNOx
Diesel Fuel and Gasoline Legislation
Diesel Fuel Regulations - EPA
Gasoline Regulations - EPA
Coal
Coal - Bridge to the Hydrogen Economy
Wood
Liquid Fuels from Wood
Biomass Feedstocks
Wood to Alcohol Fuels - Technology Status
Synthetic Liquid Fuels from Wood and Coal
Wood to Oil Process
Wood and Biomass to Fuel
Heavy Oil and Bitumen
Heavy Oil - Energy Source of the 21st Century
Canada's Heavy Oil and Tar Sands - Overview
Gas to Liquids
DOE - Natural Gas to Liquid Fuels
Rentech Inc - Gas to Liquids Technology
Steam Reforming
Steam Reforming Process - Synetix
Syn GasSynergy Technologies SynGas Process
SynGas Generation Technologies
Refining Overviews
Kittiwake : Fuel and Lube Oil Training Manual
Working Definitions of Use When Comparing Online Analyzer Results with Laboratory Test Data
Working Definitions
Accuracy – the ability of any test method, lab analysis, or analyzer, to yield the true value of the sample as a result of the measurement. That is, the result of the measurement gives the true value within the error of the measurement. The accuracy of any method is best determined by round-robin testing of that method.
Reproducibility – the determination of the spread around the true value. Determined by multiple measurements of the same samples at multiple sites (round-robin testing). It is the true error of the method.
Repeatability – the measurement of the spread around a test result from a single analyst and/or single analyzer at the same site on the same sample. However, this does not mean that the result is accurate (produces the true value).
Precision - the level to which any measurement can be accurate. That is, 46 or 46.259.
Bias – a definite offset from the true value. Consecutive single point measurements can be biased.
Model Definitions
Global Model: Any chemometric based prediction that incorporates lab analyses and samples from multiple locations on multiple streams, multiple processes, and multiple stream sources (i.e. crudes). By definition then, the prediction is accurate (predicting the true value) to within reproducibility. In order to compare a global model prediction to any single point lab measurement, the lab must first validate that the lab can meet the reproducibility requirements of the method, or ascertain it’s actual reproducibility by as described in ASTM D3764. Once the lab measurements are validated, single point lab measurement comparisons to the chemometric prediction should be within reproducibility limits. Global models are less prone to bias errors and drift.
Model Training: The process of enabling a global model to statistically recognize (i.e. f-test, mahalanobis distance, etc) the spectral results of a specific analyzer at a specific location. Requires no extensive lab sampling and analyses or exorbitant input of local unit and process specific spectral files to the model.
Local Models and Localization: Local models are built on data from a specific process unit, in a specific location, usually incorporating only lab analyses from the on-site laboratory. This effectively makes the model an on-line duplicate of the on-site laboratory and therefore subject to bias. Further, if a model is localized too much, it can be prone to drift (moving away from the true value) and/or fail to predict outside of the model space when the process changes or experiences an upset.
NMR Reproducibility: The limits of the differences between a valid, single point lab measurement and an NMR predicted result. This value is determined by the primary method and range of samples that the model is built on.
NMR Repeatability: The limits of the differences between successive predictions on a blocked in sample in the NMR under defined conditions. This value is determined bythe primary method and range of samples that the model is built on.
NMR Model and Application Strategies
NMR models based predictions are based on two types of applications: Process Control or Product Certification.
Process Control: Feed Forward and/or Feedback
- NMR models cover a wider sample range.
- Very Robust: continue to accurately predict over wide process ranges.
- Reproducibility differences between the NMR prediction and any single point lab measurement will be slightly higher.
Product Certification: i.e. Blending
- NMR model ranges are narrowed and confined with respect to the product (i.e. gasoline and blend components only)
- NMR validation set at product certification levels.
- Models are not as robust. That is, a gasoline blending model will not predict a diesel fuel as accurately as a more broad based model.
For more information on this topic please contact:
John Edwards
Manager, Process and Analytical NMR Services
Process NMR Associates LLC,
87A Sand Pit Rd
Danbury, CT 06810, USA
Tel: (203) 744-5905
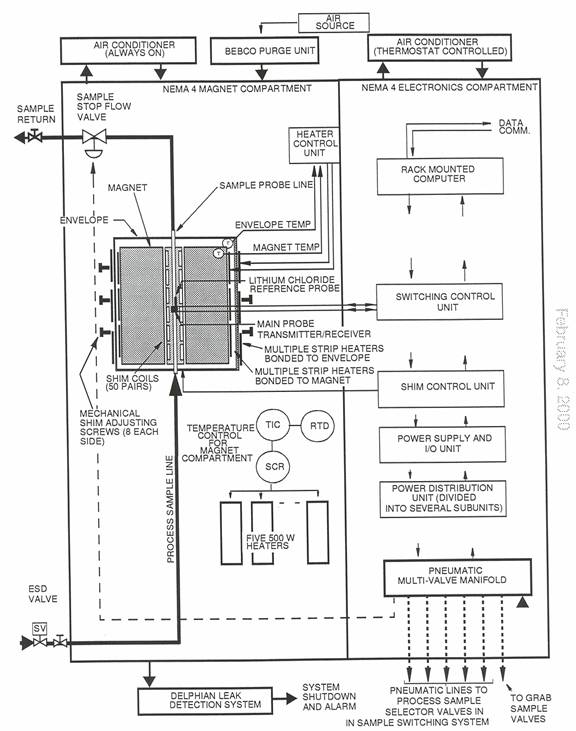
Online Process NMR Unit Description
Example of a Process NMR Unit
This analyzer, manufactured by Qualion Ltd, is marketed by Donahue Process Systems Inc.
1. Rack Mounted Computer
The rack-mounted computer provides supervisory control for all other units in the analyzer cabinet. This unit is a PC supplied with standard peripherals and I/O functions, such as an analog-to-digital converter for Channels I and Q, a system control board, control for the sample switching system, and a direct digital synthesizer (DDS). It also provides a communication link to a remote computer or modem link.
2. Switching Control Unit (RF Box)
The Switching Control Unit contains the following major components:
36 MHz crystal oscillator RF Sources Module Lock Transmitter Module
Lock Receiver Module Main Transmitter Module Main Receiver Module 36 MHz RF Filter
3. Shim Control Unit
The Shim control unit converts the digital shim signals from the computer and generates the current for the 50-shim coil pairs. It contains a communication board for coms to the computer, 50 ADC’s and 50 current generators.
4. Power Supply I/O Unit
The Power Supply I/O unit contains digital output modules for sample stop and sample switching valve control, digital input modules for enclosure alarms. A RS-485 Field Point connection for analog outputs and a RS-485 Modbus connection for digital connection to a DCS. It also provides all dc operating voltages for the system.
5. Magnet
The magnet is permanent and built from multiple segments of neodymium- boron-iron. This material is used because its very high field strength-to-mass ratio achieves the desired flux density in a small, compact package. Because the flux must be extremely uniform over the entire air gap, construction of the magnet is complex. The magnet is fabricated from several segments bonded together to form the basic assembly. In addition to the bonded segments of magnetic material, each magnet also contains 50 coils of wire arranged about a Shimming Unit mounted in the center of the magnet between the pole pieces. These coils are used as small electromagnets; the strength and polarity of which can be controlled by varying the current through them so as to improve uniformity of the overall field of the magnet assembly.
Prior to assembly in the manufacturing plant, each magnet segment is “cured” at a high temperature to stabilize its field strength. In the fabrication process, the absolute field strength of each individual segment of the magnet is measured. A computer analysis of this data then determines the best placement of each segment in the final assembly to achieve a consistent, uniform field for the assembled magnet. The segments are then bonded together to form the final magnet assembly. The assembly is placed inside a soft iron cylinder, the ‘envelope’, which constrains the magnetic flux and prevents the magnetic field outside the magnet housing from exceeding a value of as little as 5 gauss. More importantly, the iron cylinder raises field strength in the center of the magnet by pushing the flux toward the center; a process called “condensing the field”. There are electric heater strips and thermistors on the magnet and envelope to heat the assembly to the desired temperature.
6.Probe
The sample probe is mounted inside the permanent magnet in the air gap between the magnet poles. The probe contains two coils; the first, the ‘Main Coil’ is wound around a ceramic or molybdenum tube that is inserted in a hole through the shimming unit in the center of the gap between pole pieces of the magnet. The second coil, the ‘Lock Coil’ is wound on a sealed capsule of lithium chloride beside the main coil in the sample probe inside the permanent magnet. This is provided as a reference standard for setting the frequency of the main transmitter.
The constant magnetic field of the permanent magnet is perpendicular to the axis of the transmitter coil in the sample probe. Since the pulsed ac field introduced by the coil around the sample tube coincides with the vertical axis of the probe, the pulsed magnetic field is therefore perpendicular to the constant magnet field of the permanent magnet.
7. Heater Control Unit
The Magnet Heater Control Unit controls the temperature of the magnet and the envelope. The temperature of the magnet is set at 41°C and the temperature of the envelope is maintained at 37°C. The Heater Control Unit is mounted on the interior wall of the Magnet Enclosure Cabinet and has two PID loops that accept measurement input signals from the thermistors mounted on the magnet itself and the envelope. The outputs of these two PID loops control the currents to electric heater strips.
8. Enclosure
The NMR analyzer is housed in a two-door NEMA Type 4 enclosure approximately 48 inches high, 44 inches wide and 30 inches deep. Floor stands are approximately 12 inches high and are welded to the body to make it a freestanding enclosure.
The enclosure with equipment installed weighs approximately 1500 pounds and is equipped with transportation eyebolts. It is fabricated from 304 stainless steel, with all seams continuously welded and ground smooth. A center partition divides the enclosure into Magnet (left) and Electronics (right) compartments.
The magnet side is home to the gas leak detector and the ambient temperature is maintained at 72°F ±1°F. This is accomplished by means of an air conditioner on the outside left wall of the enclosure working in conjunction with a bank of five 500-watt strip heaters and a PID Controller. The ambient temperature in the Electronics side is controlled by an air conditioner on the outside right wall with an internal thermostat set at approximately 70°F.
Principle of Operation
The Qualion Process NMR System
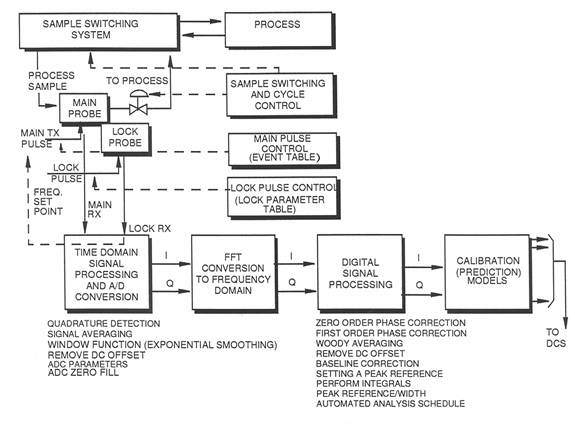
The signal is then digitally processed passed though the prediction models to obtain a prediction, the prediction is then transmitted to a DCS or receiver via analog or modbus outputs. After this has happened the sample stop valve is opened and the cycle is repeated. The lock circuit is constantly performing a NMR experiment on the Lithium Chloride, this is done as a reference. The frequency of Lithium in the NMR magnet is around 22 MHz and therefore does not interfere with observing hydrogen at 60 MHz. Because the magnet is highly dependent on temperature it is impossible to maintain a constant temperature and there for, as we know where the Lithium Chloride peak should be we can reference the main circuit to the same as the Lithium Chloride peak is away from where is should be.
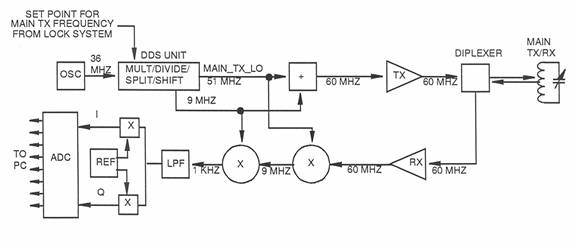
Main Circuit
The crystal oscillator outputs a 36 MHz signal, which is sent to the DDS card. The DDS unit multiplies, divides, and/or phase shifts the signal and outputs a 51 MHz signal that is used as the main transmitter and receiver local oscillators (MAIN_TX_LO and MAIN_RX_LO). A 9 MHz signal from the DDS unit is added to the MAIN_TX_LO signal to produce the main transmitter frequency of 60 MHz, which is transmitted to the diplexer and then switched to the main transmitter coil in the probe. After the main transmitter pulse is removed, the nuclei relax and generate a 60 MHz signal in the coil, which flows to the diplexer, where it is automatically switched to the receiver input. The received signal is amplified and then mixed with the MAIN _RX_LO signal (51 MHz) to produce an Intermediate Frequency (IF) of 9 MHz. This signal is then mixed with 9 MHz from the DDS card to produce an audio frequency of approximately 1 kHz. The audio signal is then split into two equal channels, I and Q, phase separated by 90°. The I and Q signals are then input to the ADC, where they are converted to digital form for input to the PC.
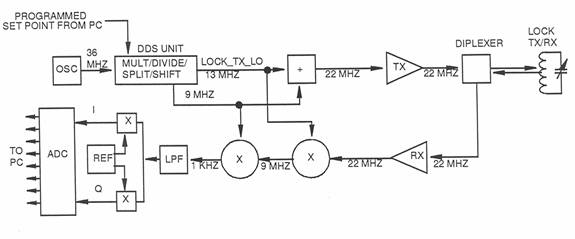
The purpose of the lock system is to provide control of the frequency of the main transmitter pulse, automatically compensating for any minor variations in magnet field strength and temperature. The lock system continuously detects the resonant frequency of the nuclei in a known sample fluid, lithium chloride, and then sets the frequency of the main transmitter to be a fixed ratio to this reference. Since the reference fluid capsule is located inside the main probe, it is subjected to the same magnetic field and temperature as the main transmitter/receiver. Therefore, a change in one affects the other. The lock system functions in the same general way as the main transmitter system, except that the basic transmitter frequency is approximately 22 MHz, the resonance frequency of lithium in a magnetic field of 1.5 tesla. The frequency of the lock transmitter is swept over a range of about 1 MHz (22-23 MHz) as it searches for the resonance frequency of lithium. When it first detects a resonant response (significant increase in signal level) as it increases frequency during the search, it stores this value and then jumps to a higher frequency and approaches resonance from the other direction. When it detects a resonance response as it approaches from the other direction, it stores this frequency and then jumps to a frequency at the mid point between the two stored values and then “locks” on this frequency as the resonance frequency of lithium. The output of the lock system is used as the set point of the main transmitter circuit, which maintains the main transmitter frequency in a fixed ratio to this “lock” frequency.
To obtain a rough magnetic field, the field homogeneity of the permanent magnet is adjusted by mechanical alignment of the magnet pole faces. The more parallel the pole faces, the more homogeneous the magnetic field. The first step in the process of adjusting magnetic homogeneity is to adjust the position of the magnet's pole faces by turning adjustment bolts which hold the pole faces in position. Adjusting these bolts tilts the pole faces relative to each other with the aim of making the pole faces more parallel. In old electromagnetic magnets, if the bolts ran out of range, thin pieces of brass were placed between the magnet yoke and the pole pieces to move the pole pieces as parallel as possible. These thin pieces of brass were also placed in other strategic locations to make the pole faces parallel in a manner not addressed by the adjustment bolts. The metal pieces were called shim stock and the seemingly endless process of placing and removing pieces of shim stock acquired the name "shimming". This is, however, a simple mechanical adjustment that only gets the NMR to a symmetric half height of 700 Hz. To increase performance, reduce the difficulty of adjusting magnetic homogeneity, and reduce the manufacturing difficulty of the magnets, an electronic "shimming" process is used, which uses a series of small electromagnets (essentially shaped coils) having very specific magnetic field contours. These small coils are placed around the sample area in different orientations. Each small coil can be used to adjust the shape of the magnetic field gradients by simply passing different currents through the coil. A complete series of these coils can be used to adjust the magnetic field homogeneity to a given level of “purity”. The process of adjusting the magnetic field homogeneity by adjusting the current in each of the coils has retained the name “shimming” and the small coils assumed the name "shims".
Systems are marketed through Donahue Process Systems Inc
Contact John Edwards for details and visit the Process NMR Associates web page for application examples.
Process NMR Associates NMR Testing Services - Examples of Solid-State NMR Applications
Solid-state NMR analyses cover a wide range of applications that cannot be addressed by liquid-state experiments. In solid-state NMR samples are place in 7mm diameter spinning rotors and spun at high speeds (3-14 kHz) in order to allow acquisition of NMR spectra with sufficient resolution to allow chemical determinations to be made.
An excellent overview of solid-state NMR is presented by Prof. Robert Schurko.
In the following pages we will give several examples of applications that have been undertaken by PNA. We have a large amount of experience in the solid-state NMR area. Some of the topics below cannot be exemplified due to restrictions placed on the analyses. Where this is the case I have included a link to a document that adequately demonstrates the use of NMR in that area.
Silicon-29 NMR of
i) Gasket Materials (Various Silicones)
ii) Heterogeneous Catalysts (clays, zeolites, aluminosilicates, various molecular sieves).
Carbon-13 NMR of
1) Combustion Chamber Deposits
2) Coals, Coke, Soils, Kerogens, Asphaltenes
3) Carbon Based Catalysts
4) Diesel Engine Soot
5) Gaskets and Seal Materials (Silicones, NBR, HNBR)
6) Polymers (EPDM, Terpolymers, Rubbers, Nylons, Polyethers, Polyurethanes, PVC,)
7) Sugars, Polysaccharides, and Polypeptides
8) Catalyst Coking Studies
9) Medicine Tablet Dosing Studies
10) Insoluble Materials from Various Sources (Compositional Studies)
11) Natural Organic Matter (Soil, Humus, Kerogen)
12) Polymorphism - Crystal Form Determination - Amorphous Content
Heteronuclear NMR Studies (31P, 27Al, 7Li, 19F, 23Na, 11B, 1H, 2H)
A) 31P NMR Of Diesel Soot
B) 2H NMR of Wax Crystallization Dynamics in Lubricant Base Oils
C) 27Al Studies of Aluminas, Surface-Modified Aluminas, Aluminosilicates and Clays
D) 11B, 27Al, and 29Si Studies of Boron Substituted Zeolites and Aluminosilicates
E) Solid State NMR of Silicates and Oxides - A Review by Stebbins
F) Zeolite Synthesis
Chemical Shift Tables
i) Carbon-13
ii) Nitrogen-15
iii) Silicon-29
iv) Aluminium-27
v) Phosphorus-31
vi) Fluorine-19
NMR Periodic Table (University of Illinois)
For more information on this topic please contact:
John Edwards
Manager, Process and Analytical NMR Services
Process NMR Associates LLC,
87A Sand Pit Rd
Danbury, CT 06810, USA
Tel: (203) 744-5905
Process NMR Associates Services - Examples of Liquid-State NMR Analysis
Analytical liquid-state NMR experiments are performed on our Varian VXR-300S superconducting NMR spectrometer operating at 7.2 Tesla. A 200 MHz Varian UnityPlus200 Spectrometer and a JEOL Eclipse 300 are also available for liquid-state experiments. We also have two Qualion process NMR units available for process NMR application development, and two low field NMR spectrometers (2.5 and 20 MHz Oxford Instruments spectrometers, for time-domain NMR experiments.
Here is a listing of past NMR projects that Process NMR Associates has been involved with.
Table 1 and Table 2 show the 1H and 13C functional group chemical shifts that can be utilized to derive detailed molecular information on samples of interest in the petroleum and petrochemical industries. Detailed molecular information can be obtained from petroleum related samples such as crude oils, base oils, diesels, bitumen, asphaltenes, naphthas. Based on these particular chemical types that can be identified it is possible to generate average molecular parameters that allow the effects of various processes to be observed when the NMR parameters are compared for samples taken before, during and after the desired processing.
The following describe several typical liquid state NMR applications that are routinely performed at PNA.
Crude oil (including heavy oil) analysis - detailed chemical breakdown obtained that allows effects of various thermal and hydrothermal upgrading processes as well as desulfurization to be followed by their effects on a series of detailed average molecule parameters. Table 3 and Table 4 shows the detailed analysis parameters that can be obtained on crude oil samples as well as all other petroleum products. Example data for crude oils can be found here.
Petroleum Product Analysis - this includes a large number of NMR interpretations on samples such as used motor oils, lubricant oils, gasolines, diesel fuels, greases, waxes, gas oils, recycled oils, fatty oils, vegetable oils, edible oils, etc. Detailed chemical information as well as the quantity and type of contaminants can be determined. For example, in used motor oils 31P NMR can be used to determine the degradation of the Zinc dithiophosphate anti-wear agents, as well as the presence of contaminants originating in the gasoline (polyether, and PIB based additives) and diesel fuel (heavy aromatics). Lubricant oil physical properties can be determined from the detailed chemistry observed in the 13C and 1H NMR spectra.
Polymer Characterization - 1H and 13C NMR can be used effectively to determine the monomer ratio of various mixed copolymers, the number average molecular weight, effectiveness of hydrogenation, olefin analysis, molecular conformation, etc. Typical polymers analyzed are PIB, PE, PP, mixed butene-ethylene, PVC, polystyrene, styrene copolymers, EP copolymers, methacrylates, synthetic rubbers, polybutenes, PTFE, nylons, specialty acrylates and polyurethanes, etc.
Multinuclear experiments - various NMR active nuclei can be studied to determine the chemical make-up of catalysts, polymers, and modified materials. Nuclei commonly observed are 29Si, 31P, 19F, 27Al, 11B. Table 5 shows the typical 29Si chemical shifts observed for siloxanes and silicates. The structure and molecular weight of these materials can be readily obtained by NMR.
Multidimensional NMR Experiments - Various specialized NMR experiments can be used to determine the basic chemical functionality of a sample (DEPT), the structural detail and connectivity (COSY, HETCOR), as well as the conformation of a molecule (2D-3D NOE experiments). For example, COSY experiments can be used to determine the conjugated diolefin content of gasolines and naphthas.
Unknown Compound Structural Elucidation - Detailed NMR experiments can be used in conjunction with sample isolation techniques to allow identification of unknown compounds that are of interest in competitive analysis reverse engineering, product marketing and field issues, customer satisfaction issues, and environmental studies.
Product Quality and Natural Product Purity - Liquid-state NMR is routinely used to determine the quality and purity of dietary supplements. Typical examples may be purity of synthesized body building food supplements, or quality of aloe vera juices and freeze dried powder. An example of pass and fail Aloe Vera quality test is given here. This Aloe Vera test is now required by the International Aloe Science Council. See this short write-up of the official test method.
Database Development - Process NMR Associates is currently developing several databases - Examples: Heavy Hydrocarbon NMR Database and Essential Oils Database.
Here are some simple NMR experiments demonstrating the methodology that can lead to full chemical characterization.
Process NMR Associates is interested in developing NMR quality control databases in conjunction with various industries. We are also not limited to NMR database development. We currently have stable stored sample sets that can be utilized to develop IR, Raman or other spectroscopy databases.
For more information on this topic please contact:
John Edwards
Manager, Process and Analytical NMR Services
Process NMR Associates LLC,
87A Sand Pit Rd
Danbury, CT 06810, USA
Tel: (203) 744-5905
Online Applications of NMR Technology
On-Line Applications of Nuclear Magnetic Resonance Technology
The applications shown here were developed by Process NMR Associates while contracted in an application development and technical marketing capacity for the Invensys MRA product. We maintain rights to these applications and market them through Donahue Process Systems Inc
Refinery Applications
Crude Blending
PDVSA CDU Optimization Presentation
Product Blending
Crude Switching
CDU Rundown
PDVSA CDU Application Presentation
FCC Feed
FCC Feed Application Note
FCC Products
Reformer/Platformer
BP Reformer Application Note
Acid Alkylation
Base Oil Manufacture
Internal Tank Farm Management
Bitumen Upgrading Process
Petroleum Exploration
Whole Crude Analysis
Custody Transfer
Petrochemical Applications
Steam Cracker
BASF Steam Cracker Application Note
Equistar ISA Presentation - Naphtha/Condensate Cracker Optimization
Aromatics Plant
Styrene-Butadiene Rubbers
Ethylene-Propylene Copolymers
Food Applications
Butter
Cream Cheese
Sour Cream, Milk, Cheeses, Yogurt
Beverages (Juices and Alcoholic)
Baby Food and Soups
Sodium Content of Food and Drink
Pulp and Paper Industry
Black Liquor Evaporation Process
LNG and Power Industry
BTU Analysis and Limited Speciation of Gas Components
The Other Aspect of Process NMR is Time Domain NMR Spectroscopy - Learn More
These Applications and Others Marketed through Donahue Process Systems Inc.
For Technical Information Contact john@process-nmr.com or see the Process NMR Associates Website
Wednesday, February 08, 2006
NMR Methods
NMR Method Patented to Determine Presence of Organic Sub-Structures in Molecules
Bristol-Myers Squibb researchers have patented a methodology to determine the presence of particular molecular substructures in compounds by PCA analysis of NMR spectroscopy data. This analysis is performed on entire spectra or particular regions defined by the substructures of interest. US Patent 6,895,340
Ex-Situ NMR available for license from Berkley Lab
Ex-situ NMR (US Patent 6,652,833) is currently available for license from the Lawrence Berkely Lab. This NMR analysis is described in a paper presented in Physique and in the following Science article (“High-Resolution NMR Spectroscopy with a Portable Single-Sided Sensor” by J. Perlo, V. Demas, F. Casanova, C. A. Meriles, J. Reimer, A. Pines, and B. Blumich (2005). Science 308: 1279-1279
Spoilage of Wine observed by NMR of Intact Bottles
A large bore superconducting magnet and specialized probe is all that is required to check that your $4500 bottle of Mouton Rothschild 1865 is not a extraordinarily expensive bottle of vinegar US Patent 6,911,822. See also this magazine atricle and the website of the company that is using the first commercial system in Morristown New Jersey – Wine Scanner Inc
Patented NMR Method for Quality Control of Medicinal Natural Products
Pattern recognition technology in conjunction with 1H and 13C NMR spectroscopy is used to determine the standard specification expected for medicinal grade natural products – see US Patent 6,806,090
Food Authentification by SNIF-NMR
Gérard Martin of Eurofins Scientific, CNRS, Nantes University, Nantes – France, writes:” Methodology: No dramatic improvement in NMR instrumentation originated during the last decade where an 11.4 T spectrometer, fitted with dedicated 2H{1H} probe and a 19F locking canal represents a good compromise between cost and efficiency. Since the main challenge for 2H-SNIF-NMR is to overcome its low sensitivity, efforts were directed in this way. The cheapest solution is to avoid the use of an internal reference that spares room in the cell for more molecules of interest and this can be done in two ways. First, the isotope ratios may be computed from the molar ratios of the deuterium isotopomeres, and the overall (D/H) value measured by Mass Spectrometry (IRMS). An alternative is to replace the chemical reference by an electronic signal conveniently generated (ERETIC method).
Wines and juices: Since 1991, the European data bank on wines has been established years after years and contains now the isotopic data of several thousands of wines from the main producing countries in Europe. Illegal enrichment of wines can be checked out and, according to the pertinence of the data bank, geographic origins of QWPSR wines can be controlled. Private ventures took also an interest in building up specific databanks of wines from third countries. The market of fruit juices has been stabilized by SNIF-NMR and the quantity of sucrose added in pure juices has been severely reduced. A joint approach using SNIF-NMR and IRMS is very useful for fighting against other sophisticated frauds.
Aromas and perfumes: The replacement of vanillin from beans (Vanilla Planifolia) by synthetic vanillin is an old practice and during thirty years, isotopic methods (IRMS and SNIF-NMR) were a nightmare to the fraudsters. Biotechnology forms the subject of the last serial of the vanillin saga: vanillin obtained from ferrulic acid by fermentation has been declared “natural” providing that all the steps and ingredients taking part in its manufacture are “natural”. The potentiality of isotopic analysis for solving the problem of the natural status of biotechnological vanillin will be discussed. Progresses in the authentication of aromatic molecules obtained from the shikimate pathway and of monoterpenes bio synthesized according to the deoxyxylulose pathway are also pointed out.
Miscellaneous applications of SNIF-NMR: During the last decade, fats and oils, fishes, dairy products and coffees received a great attention form the official and private laboratories in charge of the consumer protection. Legal (tobacco) and illegal (heroin) drugs have also been authenticated by SNIF-NMR.”
See also – Eurofins Site, and the following papers in The Chemical Educator (Elsevier), and this US Customs Service Report, explain the technique and a simple application very well.
SNIF NMR methodology has actually been patented US Patent 6,815,213, US Patent 4,550,082.
An excellent overview of where NMR analysis fits in the isotopic methods utilized in the European Union to detect fraudin food products is given by the European Commission’s Joint Research Centre
See Process NMR Associates for your NMR analysis needs.
13C NMR Analysis for Authentification of Gum Arabic
35 samples of Gum Arabic (acacia senegal) were analyzed by 13C NMR spectroscopy and the “average 13C NMR peak relative intensities” were calculated. This average 13C NMR signature can be used to determine the authenticity of a gum arabis sample and allows for observation of adulterants which are typically gums from other tropical trees (eg. gum talha (Acacia Seyal), Combretum, etc.). 13C NMR has been suggested as a specification of Gum Arabic quality in the following paper:“Gum arabic (Acacia senegal): unambiguous identification by 13C-NMR spectroscopy as an adjunct to the Revised JECFA Specification, and the application of 13C-NMR spectra for regulatory/legislative purposes.” by Anderson DM, Millar JR, Weiping W., Chemistry Department, University, Edinburgh, UK. Published in Food Additives and Contaminants, 1991 Jul-Aug;8(4):405-21
See Process NMR Associates for your 13c analysis needs.
NMR Database - Essential Oils and Carrier Oils
PNA has created and extensive NMR database comprising 160+ Essential Oils and 40+ Fixed Oils.Process NMR Associates is interested in developing a comprehensive database of NMR data that can be correlated to GC/GCMS data.If you have essential oils that have GC or GCMS data associated with them, we would be happy to provide you with a free 1H/13C analysis in exchange forincluding your EO and analytical data into the current database. Contact John Edwards if you are interested.The database includes 1H and 13C NMR spectra of the following oils:
Essential OilsAjowan EO Trachyspermum copticum – India (seed)Allspice Berry EO Pimenta officinalisAmyris EO Amyris Balsamifera – JamaicaAngelica Root EO Angelica archangelicaAngelica Seed EO Angelica archangelicaAnise Seed EO Pimpinella anisumArmoise EO Artemesia herba alba – MoroccoBalsam Peru EO Myroxylon balsamumBalsam Tolu EO Myroxylon balsamum – El SalvadorBasil EO Ocimum basilicumBay Leaf EO Pimenta racemosaBay Laurel EO Laurus nobilus – JamaicaBenzoin Liquid Resin Benzion Styrax – ChinaBergamot EO Citrus bergamiaBirch Sweet EO Betula lentaBlack Pepper EO Piper nigrum – IndiaBlood Orange EO Citrus sinensis var.Bog Myrtle EO Myrica gale – EuropeCabrueva EO Myocarpus fastigiatus – South AmericaCade EO Juniperus oxycedrus – SpainCajeput EO Melaleuca cajeputiCalamus EO Acorus calamusCamphor EO Cinnamomum camphoraCananga EO Cananga odorataCaraway Seed EO Carum carviCardamom Seed EO Elattaria cardamomumCassia EO Cinnamomum Cassia – ChinaCatnip EO Nepeta catariaCarrot Seed EO Daucus carotaCedarwood EO Cedrus atlanticaCedarwood Atlas EO Cedrus atlantica – MoroccoCedarwood Chinese EO - Cupressus funebris – ChinaCedarwood Himalayan EO Cedrus deodara – HimalayaCedarwood Mexicana EO Juniperus mexicana – Mexico (also Texas Cedarwood)Cedarwood Virginian EO Juniperus Virginiana – USACedar Leaf EO Thuja occidentalis – USACelery Seed EO Apium graveolensChamomile German EO Matricaria chamomillaChamomile Egypt EO Matricaria chamomillaChamomile Spain EO Matricaria chamomillaChamomile Roman EO Anthemis nobilisCinnamon Bark EO CinnamomumCinnamon Leaf EO Cinnamomum zeylanicumCitronella EO Cymbopogon nardusCitronella Sri Lanka EO Cymbopogon nardusCitronella Java EO Cymbopogon winterianusClary Sage EO Salvia sclareaClove Bud EO Eugenia caryophyllataClove Leaf EO Eugenia caryophyllata – MadagascarCopaiba Balsam EO Copaifera officinalisCoriander Seed EO CoriandrumCumin EO Cumimum cymimumCypress EO Cypressus sempervirensCypriol EO Cyperus scariosus – Brazil (Flowers)Davana EO Aretemesia pallensDill Seed EO Anethum sowa – IndiaDill Weed EO Anethum graveolensDragons Blood EO Croton lechleri – South America (Resin)Dwarf Pine EO Pinus mugoElemi EO Canarium luzonicumEucalyptus Citriodora EO Eucalyptus citriodoraEucalyptus Globulus EO Eucalyptus globulusEucalyptus Radiata EO Eucalyptus radiataEucalyptus Spain EO Eucalyptus globulusEucalyptus China EO Eucalyptus globulusEucalyptus Smithii EO Eucalyptus smithii – China (leaf)Fennel Sweet EO Foeniculum vulgareFennel Hungary EO Foeniculum vulgareFennel Spain EO Foeniculum vulgareFennel Rectified EO Foeniculum vulgareFennel Sweet EO Foeniculum vulgareFir Needle EO Abies albaFir Siberian EO Abies sibirica – Austria (Needle)Fir Canadian EO Abies balsamea – USA (Needle)Frankincense EO Boswellia carteriGalbanum EO Ferula galbaniflua – Turkey (Gum)Garlic EO Allium sativum – Mexico (Bulb)Geranium EO Pelargonium graveolensGeranium Rose EO Pelargonium roseum – FranceGinger EO Zingiber officinaleGinger Grass EO Cymbopogon martini – ChinaGrapefruit Pink EO Citrus paradiseGuaiacwood EO Bulnesia sarmienti – ParaguayHelichrysum EO Helichrysum angustifoliumHelichrysum Italicum EO Helichrysum italicumHop EO Humulus lupulusHyssop EO Hyssopus officinalisJuniper Berry EO Juniperus communisLabdanum EO Cistus labdanumLantane EO Lantara camara – MadagascarLavandin EO Lavendula latifoliaLavender EO Lavendula angustifoliaLemon EO Citrus limonLemongrass EO Cymbopogon citratusLemon Myrtle EO Backhousia citriodora – AustraliaLime EO Citrus aurantiumLime (Distilled) EO Citrus aurantifoliaLime (Cold Pressed) EO Citrus aurantifoliaLitsea Cubeba EO Litsea cubeba – ChinaMace EO Myristica fragrans – Spain (Husk)Mandarin EO Citrus reticulataMarjoram EO Origanum majoranaMelissa EO (Lemon Balm) Melissa officinalisMint Brazil EO Mentha arvensisMint China EO Mentha arvensisMint Japan EO Mentha arvensisMugwort EO Artemisia vulgarisMullein EO Verbascum thapsus – India (Leaf)Myrrh EO Commiphora myrrhaMyrtle EO Myrtus communisNeroli EO Citrus Aurantium – EgyptNiaouli (Cineole) EO Melaleuca viridifloraNiaouli (Nerolidol) EO Melaleuca quinquinerviaNutmeg EO Myristica fragransOat EO Avena sativaOpoponax EO Commiphora guidotti – EthiopiaOrange Bitter EO Citrus aurantiumOrange Sweet EO Citrus sinensisOregano EO Thymus capitatusPalmarosa EO Cymbopogon martiniParsley Seed EO Petroselinum sativumPatchouli EO Pogostemon cablinPennyroyal EO Mentha pulegiumPepper Black EO Piper nigrumPeppermint EO Mentha piperitaPetitgrain EO Citrus aurantiumPine Needle EO Abies sibiricaPine Dwarf EO Pinus mugo – Austria (Needle)Pine Scots EO Pinus sylvestris – Hungary (Needle Twig)Pine EO Pinus pinaster – USA (Needle)Ravensara EO Ravensara aromaticaRosalina EO Melaleuca ericifolia – AustraliaRose EO Rosa centifoliaRosemary EO Rosmarinus officinalisRosewood EO Aniba roseaodoraSage EO Salvia officinalisSandalwood EO ( Mysore ) Santalum albumSpearmint EO Mentha spicataSpike Lavender EO Lavandula latifoliaSpikenard EO Nardostachys jatamansiSpruce EO Tsuga canadensisSpruce Black EO Picea mariana – Norway (Needle)Star Anise EO Illicium verumTagetes EO Tagetes minutaTangerine EO Citrus reticulataTarragon EO Dracunculus spp.Tea Tree EO Melaleuca alternifoliaThuja EO Thuja occidentalisThyme Red EO Thymus vulgarisThyme Sweet EO Thymus vulgaris – FranceThyme White EO Thymus vulgaris – SpainTurmeric EO Curcuma longa – IndiaValerian Root EO Val ariana officinalisVerbena EO Lippia citriodoraVetiver EO Vetiveria zizanoidesWintergreen EO Gaultheria procumbenWormwood EO Artemisia absinthiumYarrow EO Achillea Millefolium – BulgariaYlang-Ylang Extra EO Canaga odorataYlang-Ylang I EO Canaga odorataYlang-Ylang III EO Canaga odorata
Carrier oilsApricot Kernel Oil Prunus armeniacaAloe Vera Oil Aloe barbadensis -USAAvocado Oil Persea americanaBorage Oil Borago officinalisCamelina Oil Camelina sativaCamellia Oil Camellia sinesis – Japan (Seed)Canola Oil Brassica napus – CanadaCastor Oil Ricinus communis – India (Seed)Coconut Oil (Fractionated) Cocos nuciferaCoconut Oil (Virgin) Cocos nuciferaCorn OilCottonseed Oil Gossypium seminis – USA (Seed)Emu OilEvening Primrose Oil Oenothers biennisFlax Seed (Linseed) Oil Linum usitatissimum – USAForaha (Tamanu) Calophyllum InophyllumGrapeseed Oil Vitis viniferaHazelnut Oil Corylus avellanaHemp Seed Oil Cannabis SativaJojoba Golden Simmondsia chinensisKukui Oil Aleurites moluccansMacadamia Nut Oil Macadamia integrifolia – AustraliaOlive Oil Olea eurpaea – ItalyPalm Oil Passiflora elacsis – USAPalm Kernel Oil Passiflora aincarnata – MalaysiaPeanut Oil Arachis hypogeae – USAPecan Oil Algooquian paccan – USAPistachio Nut Oil Pistacia vera – USARose Hip Seed Oil Rosa mosquetaSafflower Oil Carthamus tinctorius – GuatamalaSesame Oil Sesamum indicumSoya Bean Oil Soja hispida – USASunflower Oil (High Oleic) Helianthus annuusSweet Almond Oil Prunus dulcisWalnut Oil Juglans ragia – USAWheatgerm Oil Triticum vulgareAlmond Fragrance OilBitter Almond Fragrance OilCoconut Fragrance OilRosemary Oil Extract
NMR Reference: Ref: “Essential Oils Analysis by Capillary Gas Chromatography and Carbon-13 NMR Spectroscopy ” by K.H. Kubeczka and V. Formacek, 2nd Ed, Wiley, NY (2002)
Essential Oil Chemistry Reference: Journal of Essential Oil Research
See Process NMR Associates Essential Oils Page
NMR Acronyms
Excellent NMR Acronym Summary Pages – Oxford University, University of Wisconsin
NMR on a Chip
All you need to purchase with this PCI Card NMR spectrometer is an amplifier, a magnet and probe. Details can be obtained at the Spincore RadioProcessor Page. Benchtop high resolution NMR is very close to being a reality. Combining new spectrometer design with micro-probe and sample automation such as that found at Protasis will make benchtop QA-QC spectrometers a reality and place NMR spectrometers in the hands of people who can utilize them for routine testing at an affordable price.
Fat Content of Live Salmon
MOUSE NMR application on Salmon
Mobile NMR of Polyethylene Pipes
MOUSE NMR application to polyethylene pipes.
Upcoming NMR Meetings for 2006
47th ENC Conference will be held April 23 – 28, 2006, at The Asilomar Conference Center, Pacific Grove, California – Program.
EUROMAR - York will be held July 16-21, 2006 at The University of York Main Campus, Programme
22nd International Conferences on Magnetic Resonance in Biological Systems will be held August 20-25, 2006 in Goettingen, Germany – programme
6th Colloquium on Mobile NMR will be held 6-8 September 2006 in Aachen, Germany – Program
SMASH 2006 will be held September 10-13 at the Sheraton Hotel in Burlington, Vermont – Program
The NMR Symposium of the 48th Rocky Mountain Conference on Analytical Chemistry will be held July 23 – 27, 2006. The conference site is the Beaver Run Resort & Conference Center in Breckenridge, Colorado.
21st Meeting of the Central European NMR Discussion Groups will be held April 23-26, 2006, Valtice, Czech Republic in the hotel HUBERTUS in Valtice Castle
14th ISMRM will be held 6-12 May 2006 in Seattle Washington – program
ANZMAG 2006 will be held February 12-16 at the Murramarang National Park, NSW, Australia – Programme
Fast NMR Field Cycling
Stelar s.r.l of Italy manufacture a fast field cycling NMR spectrometer that shuttles a sample in and out of a varying magnetic field to generate T1 longitudinal relaxation profiles obtained by measuring T1 at a series of different magnetic field strengths. Stelar has developed low-inductance, air-coil magnets and power supplies capable of switching the field electronically to any desired value in a matter of milliseconds while, at the same time, maintaining the high field stability and homogeneity required by NMR. This allows the link between NMR relaxation phenomena and molecular dynamics to explored initially in the following application fields: the hydration of paramagnetic metal ions and organometallic complexes, the dynamics of liquid crystals, and the dynamics of proteins.
More on NMR of Wine from Physics in Action
Magnetic resonance sniffs out bad winePhysics in Action: November 1998, Claude Guillou and Fabiano Reniero
Nuclear magnetic resonance (NMR) has come a long way since it was discovered in the 1940s. This physical phenomenon, which arises from the intrinsic spin possessed by many nuclei, has provided a better understanding of the physics of nuclei and molecules. It has also been exploited to analyse the properties of many different materials in chemistry, physics, polymer science and biomedicine.
Recent developments in the use of high magnetic fields and pulsed NMR techniques have made it possible to probe the structure of organic compounds as complex as proteins. Imaging machines based on the NMR principle have also been developed, and now provide a powerful and non-invasive tool for diagnosing a variety of medical conditions. However, less well known are the applications of NMR for analysing food and drink. At the Joint Research Centre at Ispra, we are using a technique to detect whether a wine has been adulterated with foreign substances. This method is based on an NMR measurement of the deuterium content of wine.
Nuclear magnetic resonance is observed for nuclei with non-zero nuclear spin, which includes both the hydrogen nucleus (a proton) and the deuterium nucleus (a proton and a neutron). However, the physical properties of these two isotopes dictate that the NMR signal produced by deuterium nuclei is over 100 times weaker than that produced by the same number of hydrogen nuclei. The natural abundance of deuterium is also extremely low, with typical samples of hydrogen containing only about 0.015% of deuterium. This means that the NMR signal due to deuterium in a natural sample containing hydrogen is about a million times weaker than the signal due to hydrogen.
Despite this drawback, deuterium has very interesting properties for quantitative NMR. Deuterium has a quadrupole magnetic moment rather than a dipole moment, which means that it is unaffected by the nuclear Overhauser effect. This effect – in which radiofrequency radiation applied to the nucleus changes the strength of the resonance – is often exploited to enhance the NMR signal, but it also degrades the precision of quantitative techniques. Indeed, deuterium spectra generally show distinct peaks that are suitable for quantitative purposes.
An important advantage of NMR is that the deuterium content can be determined for each of the sites in a hydrogen-containing molecule that are not magnetically equivalent. For ethanol, for example, it is possible to determine separately the deuterium content of the methyl group (CH2D) and the methylene alcohol group (CHD) in the deuterium NMR spectrum. The low natural abundance of deuterium means that it is only necessary to consider molecules containing a single deuterium atom.
How does the deuterium content of wine indicate whether it has been adulterated? This is possible because the deuterium content of water in the hydrosphere and biosphere is not a constant. As an extreme example, ice at the South Pole has very low deuterium content, with a deuterium-to-hydrogen ratio of about 90 parts per million (ppm), while ocean water has a value of about 156 ppm. This natural variation is due to thermodynamic and kinetic effects that take place during the water cycle, when water evaporates from the ocean and precipitates over land. The transpiration of water from plants also favours lighter isotopes, leading to a greater abundance of deuterium in the water contained in plants.
The deuterium content of the water in any plant, including the vines used in wine production, therefore depends on several factors that can be related to the geoclimatic conditions during plant growth. Moreover, the water in the plant is used in the photosynthesis of different chemicals, in particular the production of glucose. This transfers the isotopic content of the water to the glucose and other sugars present in the plant, which means that both the metabolism and physiology of the plant influence the final deuterium content of the sugars. The deuterium content of the sugars therefore provides a good indication of their botanical origin.
Although sugars are particularly difficult to study with deuterium NMR, it is possible to detect the deuterium content of the methyl group in ethanol, which is produced during the yeast fermentation of wine. Ethanol is responsible for most of the alcoholic content of wine, and it retains a deuterium-to-hydrogen ratio representative of the sugars from which it is produced. Quantitative NMR can therefore be used to determine whether the ethanol present in wine originates from the sugars naturally present in the grapes or whether other sugars have been added to boost the alcoholic content. This practice – known in the trade as “chaptalization” – is allowed in the European Union, but only within specified limits.
A simple way of using NMR to detect sugar in wine is to compare the deuterium content of the wine being tested with a genuine wine from the same geographical origin. This requires an accurate determination of the NMR signal from the genuine wine, which is being done for all European wine-producing countries by our laboratory and other official laboratories of the European Union. The NMR data of more than 10 000 samples, together with an exhaustive description of the wines, have been collated since 1991 and now provide a powerful tool against fraudulent practice.
Other isotopic indicators, such as the content of oxygen-18 in wine or carbon-13 in ethanol, can be used to help detect other types of fraud, such as watering down the wine or false declarations of geographic origin. These parameters are usually measured by mass spectrometry, but this does not provide the site-specific information given by deuterium NMR.
Isotopic techniques, particularly the NMR analysis of deuterium, can also be used to control the authenticity of fruit juices by first converting the sugars into ethanol using controlled fermentation. Deuterium NMR can also be used to characterize the origin of natural flavours such as vanillin or raspberry. In future the combination of nuclear magnetic resonance and mass spectrometry will almost certainly lead to many other applications in detecting frauds in food.
About the authorClaude Guillou and Fabiano Reniero are at the Joint Research Centre of the European Commission, Ispra, Italy.
Olive Oil Regional Authenticity from NMR Spectroscopy
High field 1H and 13C NMR has been used to identify the region where an olive oil was produced – See Segre et al. Other methodologies have involved reacting hydroxyl groups in the olive oil with phospochloridite which allows detailed 31P NMR signatures to be obtained that reveal detailed chemistry distributions within the olive oil allowing an even greater discernment of chemical differences based on origin.
Much of the work in this area has been performed by Apostolos Spyros in Crete. Here are a few of his papers:
“Application of 31P-NMR spectroscopy in food analysis. I. Quantitative determination of mono- and diglycerides in virgin olive oils”. A. Spyros, Photis Dais, J. Agric. Food Chem., 2000, 48, 802 . (pdf)
“Quantitative determination of the distribution of free hydroxylic and carboxylic groups in unsaturated polyester and alkyd resins by 31P NMR spectroscopy”.A. Spyros, J. Appl. Polym. Sci., 2002, 83, 1635. (pdf)
“Kinetics of diglyceride formation and isomerization in virgin olive oils by employing 31P NMR spectroscopy. Formulation of a quantitative measure to assess olive oil storage history”. A. Spyros, A. Fillipidis and P. Dais, J. Agric. Food Chem., 2004, 52, 157. (pdf)
This approach has also been applied to other edible oils so that their presence as adulterants can be observed and quantified:
“Classification of edible oils by employing 31P and 1H NMR Spectroscopy in combination with multivariate statistical analysis. A proposal for the detection of seed oil adulteration in virgin olive oils “. G. Vigli, A. Fillipidis, A. Spyros and P. Dais, J. Agric. Food Chem., 2003, 51, 5715. (pdf)
“Detection of extra virgin olive oil adulteration with lampante olive oil and refined olive oil using NMR spectroscopy and multivariate statistical analysis”. G. Fragaki, A. Spyros, G. Siragakis, E. Salivaras, P. Dais, J. Agric. Food. Chem., 2005, 53, 2810.(pdf)
Please contact Process NMR Associates with your potential 31P analysis.
Subscribe to:
Posts (Atom)